McDonalds 2000 Annual Report Download - page 29
Download and view the complete annual report
Please find page 29 of the 2000 McDonalds annual report below. You can navigate through the pages in the report by either clicking on the pages listed below, or by using the keyword search tool below to find specific information within the annual report.-
 1
1 -
2
-
3
-
4
-
5
-
6
-
7
-
8
-
9
-
10
-
11
-
12
-
13
-
14
-
15
-
16
-
17
-
18
-
 19
19 -
 20
20 -
 21
21 -
 22
22 -
 23
23 -
 24
24 -
 25
25 -
 26
26 -
 27
27 -
 28
28 -
 29
29 -
 30
30 -
 31
31 -
 32
32 -
 33
33 -
 34
34 -
 35
35 -
 36
36 -
 37
37 -
 38
38 -
 39
39 -
40
-
41
-
42
-
43
-
44
-
45
-
46
-
47
-
48
-
49
-
50
-
51
-
52
 |
 |

Nature of business
The Company operates in the food service industry and primarily
operates quick-service restaurant businesses under the McDonald’s
brand. Approximately 80% of McDonald’s restaurants and more
than 80% of the Systemwide sales of McDonald’s restaurants are
in eight markets: Australia, Brazil, Canada, France, Germany, Japan,
the U.K. and the U.S. Throughout this discussion, McDonald’s
restaurant businesses in these eight markets collectively are referred
to as “major markets.”
To capture additional meal occasions, the Company also operates
other restaurant concepts: Aroma Café, Boston Market, Chipotle
Mexican Grill and Donatos Pizza. Collectively these four businesses
are referred to as “Other Brands.” Throughout this discussion, Other
Brands’ financial information is included in the Other segment.
In February 2001, the Company acquired a minority interest in
U.K.-based Pret A Manger, which is a quick-service food concept
that serves mainly sandwiches, snacks and drinks during lunchtime.
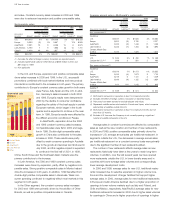
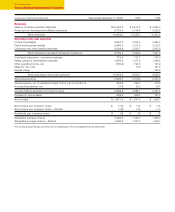
Consolidated operating results
Operating results
2000 1999 1998
DOLLARS IN MILLIONS,
Increase/ Increase/
EXCEPT PER SHARE DATA
Amount (decrease) Amount (decrease) Amount
Systemwide sales $40,181 4% $38,491 7% $35,979
Revenues
Sales by Company-
operated restaurants $10,467 10% $ 9,512 7% $ 8,895
Revenues from franchised
and affiliated restaurants 3,776 1 3,747 6 3,526
Total revenues 14,243 7 13,259 7 12,421
Operating costs
and expenses
Company-operated
restaurants 8,750 12 7,829 8 7,261
Franchised restaurants 772 5 738 9 678
Selling, general &
administrative expenses 1,587 7 1,477 1 1,458
Other operating income, net (196) nm (124) nm (60)
Made For You costs –nm 19 nm 162
Special charge –nm –nm 160
Total operating costs
and expenses 10,913 10 9,939 3 9,659
Operating income
(1)
3,330 –3,320 20 2,762
Interest expense 430 8 396 (4) 414
Nonoperating expense, net 18 nm 40 (2) 41
Income before provision
for income taxes
(1)
2,882 –2,884 25 2,307
Provision for income taxes
(1)
905 (3) 936 24 757
Net income
(1)
$ 1,977 2% $ 1,948 26% $ 1,550
Net income
per common share
(1)
$ 1.49 3% $ 1.44 26% $ 1.14
Net income
per common share–
diluted
(1)
1.46 5 1.39 26 1.10
(1) The 1998 results include $162 million of Made For You costs and the
$160 million special charge for a pretax total of $322 million ($219 million
after tax or $0.16 per share). See discussion on pages 42 and 43.
nm Not meaningful.
The following table presents the 2000 growth rates for reported and
constant currency results as well as the 1999 growth rates for reported
results, results adjusted for 1998 Made For You costs and the 1998
special charge, and the adjusted results on a constant currency
basis. All information in constant currencies excludes the effect of
foreign currency translation on reported results, except for hyperinfla-
tionary economies, such as Russia, whose functional currency is the
U.S. Dollar.
Constant currency operating results
2000 1999
Increase Increase
As Constant As Constant
reported currency
(1)
reported Adjusted
(2)
currency
(1,2)
Systemwide sales 4% 7%
7% 7% 8%
Revenues 7 12
7710
Operating income – 5
20 8 10
Net income 2 6
26 10 13
Net income per
common share 3 8
26 11 13
Net income per
common share–diluted 5 10
26 10 13
(1) Excludes the effect of foreign currency translation on reported results.
(2) Excludes 1998 Made For You costs and the 1998 special charge.
The primary currencies negatively affecting reported results in
2000 were the Euro, which is the currency in 12 of our European
markets including France and Germany, the British Pound and the
Australian Dollar, partly offset by the
stronger Japanese Yen. In 1999, the
reported results were negatively affected
primarily by the Brazilian Real, the Euro
and the British Pound, partly offset by
the stronger Japanese Yen, Australian
Dollar and Southeast Asian currencies.
In 2000 and 1999, the stronger
Japanese Yen had a greater positive
currency translation effect on sales
compared with revenues. This is due to
our affiliate structure in Japan. Under this
structure, we record a royalty in revenues
based on a percent of Japan’s sales, whereas all of Japan’s sales
are included in Systemwide sales. For this reason, growth rates for
Systemwide sales in both years were less negatively affected by
foreign currency translation than were revenues.
Systemwide sales
For the first time, Systemwide sales exceeded $40 billion, increasing
7% in constant currencies in 2000. Systemwide sales include sales
by all restaurants, whether operated by the Company, by franchisees
or by affiliates operating under joint-venture agreements. We continue
to focus on increasing market share through positive comparable
sales and strategic restaurant development, with an emphasis on
improving customer satisfaction through quality, service, cleanliness
Year in review
Year in review 27