McDonalds 2000 Annual Report Download - page 34
Download and view the complete annual report
Please find page 34 of the 2000 McDonalds annual report below. You can navigate through the pages in the report by either clicking on the pages listed below, or by using the keyword search tool below to find specific information within the annual report.-
 1
1 -
2
-
3
-
4
-
5
-
6
-
7
-
8
-
9
-
10
-
11
-
12
-
13
-
14
-
15
-
16
-
17
-
18
-
19
-
20
-
21
-
22
-
23
-
 24
24 -
 25
25 -
 26
26 -
 27
27 -
 28
28 -
 29
29 -
 30
30 -
 31
31 -
 32
32 -
 33
33 -
 34
34 -
 35
35 -
 36
36 -
 37
37 -
 38
38 -
 39
39 -
 40
40 -
 41
41 -
 42
42 -
 43
43 -
 44
44 -
45
-
46
-
47
-
48
-
49
-
50
-
51
-
52
 |
 |
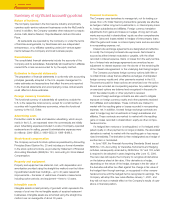
Net losses from property dispositions reflected the write-off of
$24 million of software in 1999 and a high number of restaurant
closings in 1998.
Made For You costs and the special charge related to the 1998
home office productivity initiative are discussed on pages 42 and 43.
Interest expense
Interest expense increased in 2000 due to higher average debt
levels, partly offset by weaker foreign currencies. In 1999, interest
expense decreased due to lower average interest rates and weaker
foreign currencies, partly offset by higher average debt levels. Average
debt levels were higher in both years because of the Company using
available credit capacity to fund share repurchases.
Nonoperating expense, net
Nonoperating expense includes miscellaneous income and expense
items such as interest income, minority interests, and gains and
losses related to other investments, financings and translation.
Results in 2000 reflected lower minority interest expense, lower
translation losses and a gain related to the sale of a partial owner-
ship interest in a majority-owned subsidiary outside the U.S.
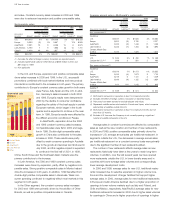
Provision for income taxes
The effective income tax rate was 31.4% for 2000, compared with
32.5% for 1999 and 32.8% for 1998. The decrease in the income
tax rate in 2000 was the result of a tax benefit resulting from an
international transaction. The Company expects its 2001 effective
income tax rate to be between 32.0% and 33.0%.
Consolidated net deferred tax liabilities included tax assets, net
of valuation allowance, of $523 million in 2000 and $557 million in
1999. Substantially all of the tax assets arose in the U.S. and other
profitable markets, and a majority of them are expected to be real-
ized in future U.S. income tax returns.
Net income and net income
per common share
In 2000, net income increased $29 million or 2% and diluted net
income per common share increased $.07 or 5%. On a constant
currency basis, these increases were $122 million or 6% and $.14
or 10%, respectively. The spread between the percent increase in
net income and net income per common share was due to lower
weighted-average shares outstanding as a result of shares repur-
chased and a less dilutive effect from stock options. In 1999, net
income and diluted net income per common share increased 10%
(13% for both in constant currencies), excluding 1998 Made For You
costs and the 1998 special charge. Including these items, reported
net income and diluted net income per common share both
increased 26% in 1999.
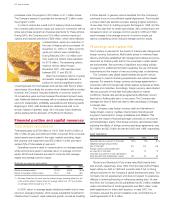
Cash flows
The Company generates significant cash from operations and has
substantial credit capacity to fund operating and discretionary spend-
ing. Cash from operations totaled $2.8 billion in 2000 and exceeded
capital expenditures for the tenth consecutive year. This amount was
less than in 1999, primarily due to higher income tax payments as a
result of lower tax benefits related to stock option exercises and higher
tax gains on the termination of foreign currency exchange agree-
ments. Higher gains on sales of restaurant businesses and property
also reduced cash provided by operations, but generated about
$40 million of additional cash from investing activities. In 1998, cash
provided by operations was reduced by approximately $135 million
of Made For You incentive payments. Cash provided by operations,
along with borrowings and other sources of cash, is used for capital
expenditures, share repurchases, dividends and debt repayments.
Cash provided by operations
DOLLARS IN MILLIONS 2000 1999 1998
Cash provided by operations $2,751 $3,009 $2,766
Free cash flow (1) 806 1,141 887
Cash provided by operations
as a percent of capital expenditures 141% 161% 147%
Cash provided by operations
as a percent of average total debt 35 42 41
(1) Cash provided by operations less capital expenditures.
In addition to its free cash flow, the Company can meet short-term
funding needs through commercial paper borrowings and line of credit
agreements. Accordingly, the Company strategically and purposefully
maintains a relatively low current ratio, which was .70 at year-end 2000.
Capital expenditures and
restaurant development
Capital expenditures increased $77 million or 4% in 2000 and
decreased $11 million or 1% in 1999. The increase in 2000 was
due to higher spending for Other Brands and the consolidation of
Argentina and Indonesia, partly offset by weaker foreign currencies.
Capital expenditures for McDonald’s restau-
rants in 2000 and 1999 reflect our strategy of
leasing a higher proportion of new sites and the
U.S. building program, which gives franchisees
the option to own new restaurant buildings.
Capital expenditures in 1999 included
increased capital outlays for existing U.S.
Company-operated restaurants related to
implementation of the Made For You food
preparation system and spending to update
and refresh existing U.S. restaurants. About
90% of qualifying new and rebuilt U.S. tradi-
tional restaurant buildings developed in 2000
are owned by franchisees. In addition, the
Company leased the land for substantially all
new U.S. traditional restaurants opened in
2000. The U.S. building program, which began
32 Year in review
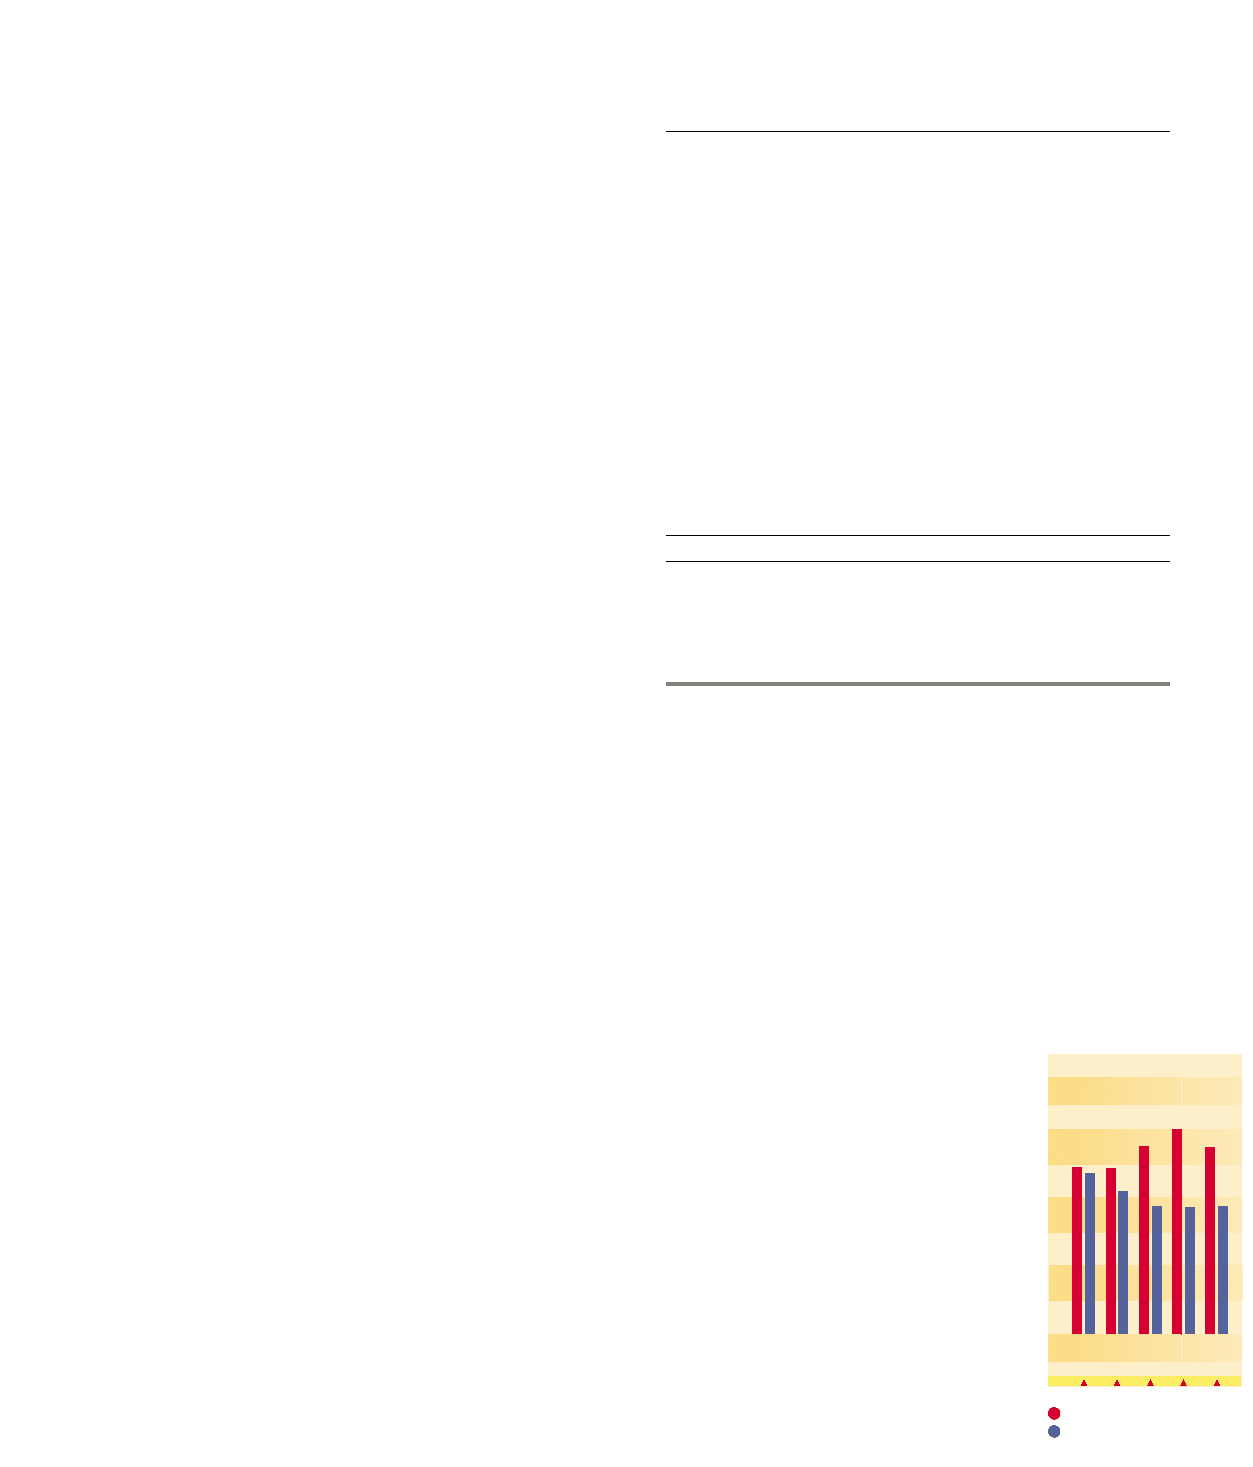
$3.0
2.5
2.0
1.5
1.0
.5
20001996
Cash provided by operations
Capital expenditures
Cash flow and
capital expenditures
in billions