McDonalds 2000 Annual Report Download - page 47
Download and view the complete annual report
Please find page 47 of the 2000 McDonalds annual report below. You can navigate through the pages in the report by either clicking on the pages listed below, or by using the keyword search tool below to find specific information within the annual report.-
 1
1 -
2
-
3
-
4
-
5
-
6
-
7
-
8
-
9
-
10
-
11
-
12
-
13
-
14
-
15
-
16
-
17
-
18
-
19
-
20
-
21
-
22
-
23
-
24
-
25
-
26
-
27
-
28
-
29
-
30
-
31
-
32
-
33
-
34
-
35
-
36
-
 37
37 -
 38
38 -
 39
39 -
 40
40 -
 41
41 -
 42
42 -
 43
43 -
 44
44 -
 45
45 -
 46
46 -
 47
47 -
 48
48 -
 49
49 -
 50
50 -
 51
51 -
 52
52
 |
 |

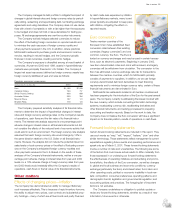
Leasing arrangements
At December 31, 2000, the Company was lessee at 6,055 restau-
rant locations through ground leases (the Company leases the land
and the Company or franchisee owns the building) and at 6,984
restaurant locations through improved leases (the Company leases
land and buildings). Lease terms for most restaurants are generally
for 20 to 25 years and, in many cases, provide for rent escalations
and renewal options, with certain leases providing purchase options.
For most locations, the Company is obligated for the related occu-
pancy costs including property taxes, insurance and maintenance.
In addition, the Company is lessee under noncancelable leases
covering offices and vehicles.
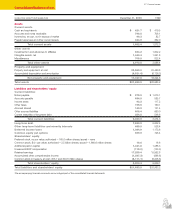
Future minimum payments required under existing operating
leases with initial terms of one year or more are:
IN MILLIONS Restaurant Other Total
2001 $ 748.3 $ 63.3 $ 811.6
2002 735.3 55.1 790.4
2003 705.8 46.4 752.2
2004 676.2 38.9 715.1
2005 623.5 34.8 658.3
Thereafter 6,018.7 221.0 6,239.7
Total minimum payments $9,507.8 $459.5 $9,967.3
Rent expense was (in millions): 2000–$886.4; 1999–$796.3;
1998–$723.0. These amounts included percent rents in excess of
minimum rents (in millions): 2000–$133.0; 1999–$117.1;
1998–$116.7.
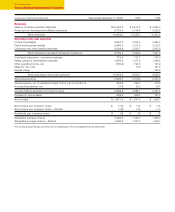
Property and equipment
IN MILLIONS December 31, 2000 1999
Land $ 3,932.7 $ 3,838.6
Buildings and improvements on owned land 8,250.0 7,953.6
Buildings and improvements on leased land 7,513.3 7,076.6
Equipment, signs and seating 3,172.2 2,906.6
Other 700.8 675.4
23,569.0 22,450.8
Accumulated depreciation and amortization (6,521.4) (6,126.3)
Net property and equipment $17,047.6 $16,324.5
Depreciation and amortization expense was (in millions):
2000–$900.9; 1999–$858.1; 1998–$808.0.
Employee benefit plans
The Company’s Profit Sharing Program for U.S.-based employees
includes profit sharing, 401(k) and leveraged employee stock owner-
ship (ESOP) features. The 401(k) feature allows participants to make
pretax contributions that are partly matched from shares released
under the ESOP. Executives, staff and restaurant managers partici-
pate in additional ESOP allocations and profit sharing contributions,
based on their compensation. The profit sharing contribution is dis-
cretionary, and the Company determines the amount each year.
Participant 401(k) contributions, profit sharing contributions and
any related earnings can be invested in McDonald’s common stock
or among six other investment alternatives. The Company’s match-
Financial review 45
ing contributions and ESOP allocations are generally invested in
McDonald’s common stock.
Total U.S. costs for the Profit Sharing Program, including related
nonqualified benefits, were (in millions): 2000–$49.6; 1999–$49.4;
1998–$63.3.
Certain subsidiaries outside the U.S. also offer profit sharing,
stock purchase or other similar benefit plans. Total plan costs
outside the U.S. were (in millions): 2000–$38.1; 1999–$37.2;
1998–$37.5.
Other postretirement benefits and postemployment benefits,
excluding severance benefits related to the 1998 home office
productivity initiative, were immaterial.
Stock options
At December 31, 2000, the Company had three stock-based
compensation plans, two for employees and one for nonemployee
directors. Options to purchase common stock are granted at the
fair market value of the stock on the date of grant. Therefore, no
compensation cost has been recognized in the consolidated finan-
cial statements for these plans.
Substantially all of the options become exercisable in four equal
installments, beginning a year from the date of the grant, and expire
10 years from the grant date. At December 31, 2000, the number of
shares of common stock reserved for issuance under the plans was
185.3 million, including 9.5 million shares available for future grants.
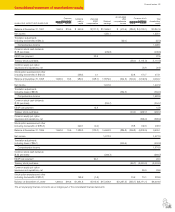
A summary of the status of the Company’s plans as of
December 31, 2000, 1999 and 1998, and changes during the years
then ended, is presented in the following table.
2000 1999 1998
Weighted- Weighted- Weighted-
average average average
Shares exercise Shares exercise Shares exercise
Options
IN MILLIONS
price
IN MILLIONS
price
IN MILLIONS
price
Outstanding at
beginning of year 164.7 $23.06 164.0 $19.32 156.3 $16.79
Granted 26.5 35.16 25.4 40.35 33.7 25.90
Exercised (10.8) 13.68 (18.8) 13.89 (22.8) 12.00
Forfeited (4.6) 27.81 (5.9) 18.01 (3.2) 21.06
Outstanding at
end of year 175.8 $25.34 164.7 $23.06 164.0 $19.32
Options
exercisable at
end of year 79.3 69.4 64.4
Options granted each year were 2.0%, 1.9% and 2.5% of
weighted-average common shares outstanding for 2000, 1999 and
1998, representing grants to approximately 14,100, 12,700 and
11,500 employees in those three years. When stock options are
exercised, shares are issued from treasury stock.
The average per share cost of treasury stock issued for option
exercises over the last three years was about $7.00. The average
option exercise price has consistently exceeded the average cost of
treasury stock issued for option exercises because the Company
prefunds the program through share repurchases. As a result, stock
option exercises have generated additional capital, since cash
received from employees has exceeded the Company’s average