McDonalds 2000 Annual Report Download - page 43
Download and view the complete annual report
Please find page 43 of the 2000 McDonalds annual report below. You can navigate through the pages in the report by either clicking on the pages listed below, or by using the keyword search tool below to find specific information within the annual report.-
 1
1 -
2
-
3
-
4
-
5
-
6
-
7
-
8
-
9
-
10
-
11
-
12
-
13
-
14
-
15
-
16
-
17
-
18
-
19
-
20
-
21
-
22
-
23
-
24
-
25
-
26
-
27
-
28
-
29
-
30
-
31
-
32
-
 33
33 -
 34
34 -
 35
35 -
 36
36 -
 37
37 -
 38
38 -
 39
39 -
 40
40 -
 41
41 -
 42
42 -
 43
43 -
 44
44 -
 45
45 -
 46
46 -
 47
47 -
 48
48 -
 49
49 -
 50
50 -
 51
51 -
 52
52
 |
 |

Common equity put options
During 2000, 1999 and 1998, the Company sold 16.8 million,
27.0 million and 7.3 million common equity put options, respectively,
in connection with its share repurchase program. Premiums received
are recorded in shareholders’ equity as a reduction of the cost of
treasury stock purchased and were $56.0 million in 2000, $97.5 mil-
lion in 1999 and $20.5 million in 1998. At December 31, 2000,
21.0 million common equity put options were outstanding. The
options expire at various dates through November 2001 at exercise
prices between $30.11 and $41.98. At December 31, 2000, the
$699.9 million total exercise price of these outstanding options was
classified in common equity put options, and the related offset was
recorded in common stock in treasury, net of the premiums received.
Per common share information
Diluted net income per common share is calculated using net
income divided by diluted weighted-average shares. Diluted weighted-
average shares include weighted-average shares outstanding plus
the dilutive effect of stock options, calculated using the treasury
stock method. The dilutive effect of stock options was (in millions
of shares): 2000–33.3; 1999–48.9; 1998–40.4.
Statement of cash flows
The Company considers short-term, highly liquid investments to
be cash equivalents. The impact of fluctuating foreign currencies on
cash and equivalents was not material.
Segment and geographic information
The Company operates in the food service industry. Substantially
all revenues result from the sale of menu products at restaurants
operated by the Company, franchisees or affiliates. The Company’s
reportable segments are based on geographic area. All intercompany
revenues and expenses are eliminated in computing revenues and
operating income. Operating income includes the Company’s share
of operating results of affiliates after interest expense and income
taxes, except for U.S. affiliates, which are reported before income
taxes. Royalties and other payments received from subsidiaries
outside the U.S. were (in millions): 2000–$603.6; 1999–$568.3;
1998–$526.0.
The Other segment includes McDonald’s restaurant operations
in Canada, the Middle East and Africa as well as results from Aroma
Café, Boston Market, Chipotle Mexican Grill and Donatos Pizza.
Segment operating income has been restated for all years
presented to break out corporate general & administrative expenses
from the operating segments to be consistent with the way segment
performance currently is evaluated by Company management.
Corporate general & administrative expenses are now included as
the corporate segment of operating income. These expenses are
composed of home office support costs in areas such as facilities,
finance, human resources, information technology, legal, supply
chain management and training.
Corporate and U.S. segment assets, capital expenditures and
depreciation and amortization also have been restated to conform
to the new presentation. Corporate assets include corporate cash,
investments, asset portions of financing instruments, home office
facilities, deferred tax assets and certain intangibles.
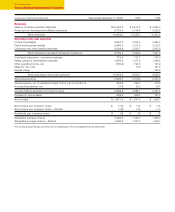
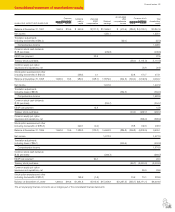
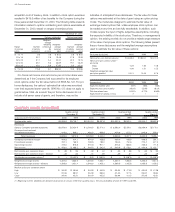
IN MILLIONS 2000 1999 1998
U.S. $ 5,259.1 $ 5,093.0 $ 4,868.1
Europe 4,753.9 4,924.9 4,466.7
Asia/Pacific 1,987.0 1,832.3 1,633.2
Latin America 949.3 680.3 814.7
Other 1,293.7 728.8 638.7
Total revenues $14,243.0 $13,259.3 $12,421.4
U.S. $ 1,773.1 $ 1,653.3 $ 1,201.4(1)
Europe 1,180.1 1,256.5 1,167.5
Asia/Pacific 441.9 421.9 359.9
Latin America 102.3 133.0 189.2
Other 94.1 117.4 120.3
Corporate (261.8) (262.5) (276.4)
Total operating income $ 3,329.7 $ 3,319.6 $ 2,761.9(1)
U.S. $ 7,876.7 $ 7,674.3 $ 7,397.8
Europe 7,083.7 6,966.8 6,932.1
Asia/Pacific 2,789.7 2,828.2 2,659.7
Latin America 1,855.6 1,477.5 1,339.6
Other 1,069.3 979.3 678.7
Corporate 1,008.5 1,057.1 776.5
Total assets $21,683.5 $20,983.2 $19,784.4
U.S. $ 468.6 $ 426.4 $ 392.4
Europe 797.6 881.8 870.2
Asia/Pacific 224.4 188.4 224.0
Latin America 245.7 213.2 236.8
Other 161.2 112.3 102.8
Corporate 47.6 45.7 53.1
Total capital expenditures $ 1,945.1 $ 1,867.8 $ 1,879.3
U.S. $ 417.6 $ 399.7 $ 375.9
Europe 296.5 305.2 268.0
Asia/Pacific 120.5 114.9 97.3
Latin America 69.4 45.5 42.9
Other 60.8 46.2 40.6
Corporate 45.9 44.8 56.4
Total depreciation and amortization $ 1,010.7 $ 956.3 $ 881.1
(1) Includes $161.6 million of Made For Your costs and the $160.0 million special
charge related to the home office productivity initiative.
Total long-lived assets, primarily property and equipment and
intangibles, were (in millions): Consolidated—2000–$19,798.3;
1999–$19,082.8; 1998–$18,244.4. U.S. based—2000–$8,373.2;
1999–$7,984.9; 1998–$7,533.2.
Franchise arrangements
Individual franchise arrangements generally include a lease and a
license and provide for payment of initial fees, as well as continuing
rent and service fees to the Company, based upon a percent of
sales with minimum rent payments. McDonald’s franchisees are
granted the right to operate a restaurant using the McDonald’s
system and, in certain cases, the use of a restaurant facility, generally
for a period of 20 years. Franchisees pay related occupancy costs
including property taxes, insurance and maintenance. Franchisees
Financial review 41