McDonalds 2000 Annual Report Download - page 30
Download and view the complete annual report
Please find page 30 of the 2000 McDonalds annual report below. You can navigate through the pages in the report by either clicking on the pages listed below, or by using the keyword search tool below to find specific information within the annual report.-
 1
1 -
2
-
3
-
4
-
5
-
6
-
7
-
8
-
9
-
10
-
11
-
12
-
13
-
14
-
15
-
16
-
17
-
18
-
19
-
 20
20 -
 21
21 -
 22
22 -
 23
23 -
 24
24 -
 25
25 -
 26
26 -
 27
27 -
 28
28 -
 29
29 -
 30
30 -
 31
31 -
 32
32 -
 33
33 -
 34
34 -
 35
35 -
 36
36 -
 37
37 -
 38
38 -
 39
39 -
 40
40 -
41
-
42
-
43
-
44
-
45
-
46
-
47
-
48
-
49
-
50
-
51
-
52
 |
 |

Average annual sales—McDonald’s restaurants
2000 1999 1998
Increase/ Increase/
(decrease) (decrease)
Constant Constant
DOLLARS IN THOUSANDS
Amount currency
(2)
Amount currency
(2)
Amount
Per restaurant (1)
Traditional:
U.S. $1,647 1% $1,625 3% $1,584
Europe 1,851 (2) 2,130 –2,227
Asia/Pacific 1,420 (2) 1,446 (7) 1,433
Latin America 1,333 (7) 1,464 (5) 1,890
Canada, Middle East
& Africa 1,336 1 1,326 –1,340
Satellite:
U.S. $ 536 9% $ 490 7% $ 459
Outside the U.S.
(3,4)
598 2 561 2 490
Per new restaurant (5)
Traditional:
U.S. $1,570 7% $1,473 11% $1,332
Europe 1,430 (4) 1,673 3 1,700
Asia/Pacific 1,219 6 1,131 3 1,009
Latin America 1,030 (9) 1,152 (12) 1,634
Canada, Middle East
& Africa 911 (11) 1,045 15 943
Satellite:
(6)
Outside the U.S.
(3,4)
$ 649 8% $ 574 –$ 504
(1) McDonald’s restaurants in operation at least 13 consecutive months.
(2) Excludes the effect of foreign currency translation on reported results.
(3) Prior years have been restated to exclude dessert-only kiosks.
(4) Represents satellite restaurants located in Canada and Japan, which comprise
substantially all satellites outside the U.S.
(5) McDonald’s restaurants in operation at least 13 consecutive months but not
more than 25 months.
(6) Excludes U.S. because the Company is not currently opening a significant
number of satellite restaurants in the U.S.
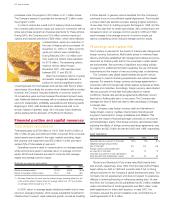
Average sales in constant currencies are affected by comparable
sales as well as the size, location and number of new restaurants.
In 2000 and 1999, positive comparable sales primarily drove the
increases in U.S. average annual sales per traditional restaurant. In
segments outside the U.S., the decreases in average annual sales
per traditional restaurant on a constant currency basis were primarily
due to the significant number of new restaurants added.
The number of new restaurants affects average sales as new
restaurants historically have taken a few years to reach long-term
volumes. In addition, over the last several years we have opened
more restaurants outside the U.S. in lower density areas and in
countries with lower average sales volumes and correspondingly
lower average development costs.
In 2000 and 1999, average sales for new U.S. traditional restau-
rants increased due to selective expansion in higher volume loca-
tions and the development of larger facilities that support higher
average sales. In 2000, average sales for new traditional restaurants
in Europe and Latin America declined due to a higher proportion of
openings in lower volume markets such as Italy and Poland, and
Chile and Mexico, respectively. Asia/Pacific’s average sales for new
traditional restaurants increased in 2000 due to higher sales volumes
for openings in China and a higher proportion of openings in higher
and value. Constant currency sales increases in 2000 and 1999
were due to restaurant expansion and positive comparable sales.
Systemwide sales
2000 1999 1998
Increase/(decrease) Increase/(decrease)
DOLLARS IN
As Constant As Constant
MILLIONS
Amount reported currency
(1)
Amount reported currency
(1)
Amount
U.S. $19,573 3% na $19,006 5% na $18,123
Europe 9,293 (3) 9% 9,557 7 12% 8,909
Asia/Pacific 7,051 10 9 6,436 15 6 5,579
Latin America 1,790 7 9 1,665 (5) 15 1,761
Other
(2)
2,474 35 36 1,827 14 15 1,607
Total $40,181 4% 7% $38,491 7% 8% $35,979
(1) Excludes the effect of foreign currency translation on reported results.
(2) Includes Systemwide sales for Other Brands of $605 million in 2000 and
$91 million in 1999.
na Not applicable.
In the U.S. and Europe, expansion and positive comparable sales
drove sales increases in 2000 and 1999. In the U.S., successful
promotions combined with local market initiatives and new product
introductions contributed to the increases in both years. The primary
contributors to Europe’s constant currency sales growth in both years
were France, Italy, Spain and the U.K. In addi-
tion, Germany’s sales increased in both 2000
and 1999. Europe’s results were dampened in
2000 by the decline in consumer confidence
regarding the safety of the beef supply in certain
European markets, which began in the fourth
quarter and is expected to continue in the near
term. In 1999, Europe’s results were affected by
the difficult economic conditions in Russia.
In Asia/Pacific, expansion drove the 2000
and 1999 constant currency sales increases.
Comparable sales were flat in 2000 and nega-
tive in 1999. Double-digit comparable sales
growth in China also contributed to the sales
increase in 2000. These results were partly
offset by weak consumer spending in Australia
due to the goods and services tax introduced in
July 2000, and this negative impact is expected
to continue in the first half of 2001. In 1999,
China, South Korea and the Southeast Asian markets were the
primary contributors to the increase.
In Latin America, the 2000 and 1999 constant currency sales
increases were driven by expansion, partly offset by negative com-
parable sales. Strong positive comparable sales in Mexico helped
drive the increases in both years. In addition, 1999 benefited from
double-digit positive comparable sales in Venezuela. Weak con-
sumer spending continued to negatively affect most markets in this
segment in both years.
In the Other segment, the constant currency sales increases
for 2000 and 1999 were primarily driven by the addition of Other
Brands, as well as positive comparable sales in Canada.
28 Year in review
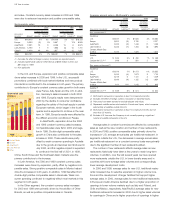
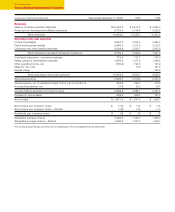
Systemwide sales
in billions
30
25
20
15
10
5
$40
35
20001996
United States
Europe
Asia/Pacific
Latin America
Other