McDonalds 2000 Annual Report Download - page 6
Download and view the complete annual report
Please find page 6 of the 2000 McDonalds annual report below. You can navigate through the pages in the report by either clicking on the pages listed below, or by using the keyword search tool below to find specific information within the annual report.-
 1
1 -
 2
2 -
 3
3 -
 4
4 -
 5
5 -
 6
6 -
 7
7 -
 8
8 -
 9
9 -
 10
10 -
 11
11 -
 12
12 -
 13
13 -
 14
14 -
 15
15 -
 16
16 -
 17
17 -
18
-
19
-
20
-
21
-
22
-
23
-
24
-
25
-
26
-
27
-
28
-
29
-
30
-
31
-
32
-
33
-
34
-
35
-
36
-
37
-
38
-
39
-
40
-
41
-
42
-
43
-
44
-
45
-
46
-
47
-
48
-
49
-
50
-
51
-
52
 |
 |

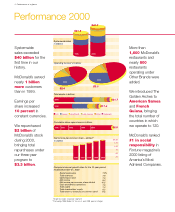
Systemwide sales
in billions
$31.8
1996 2000
$40.2
Operating income* in billions
$2.6
1996
$3.3
2000
Total assets in billions
U.S. Europe Asia/Pacific Latin America Other Corporate
$5.5
199819971996 1999 2000
Cumulative share repurchases in billions
Net income per common share—diluted**
in dollars $1.50
.25
.50
.75
1.00
1.25
20001999199819971996
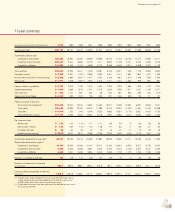
Compound annual growth rates for the 10-year period
ended December 31, 2000
Systemwide sales
Total revenues
Operating income
Net income
Net income per common share–diluted
Cash provided by operations
Total assets
Total shareholders' equity
Total return to investors on common stock
7.9
7.6
9.4
10.5
7.8
7.4
8.2
17.5
7.9%
$21.7
$17.4
2000
1996
Performance 2000
*Graph excludes corporate segment.
**Excluding 1998 Made For You costs and 1998 special charge.
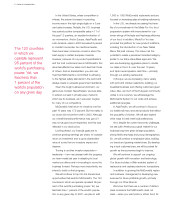
Systemwide
sales exceeded
$40 billion for the
first time in our
history.
McDonald’s served
nearly 1 billion
more customers
than in 1999.
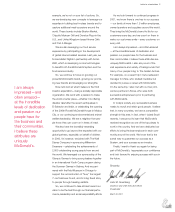
Earnings per
share increased
10 percent in
constant currencies.
We repurchased
$2 billion of
McDonald’s stock
during 2000,
bringing total
repurchases under
our three-year
program to
$3.3 billion.
More than
1,600 McDonald’s
restaurants and
nearly 800
restaurants
operating under
Other Brands were
added.
We introduced The
Golden Arches to
American Samoa
and French
Guiana, bringing
the total number of
countries in which
we operate to 120.
McDonald’s ranked
#1 in social
responsibility in
Fortune magazine’s
2000 listing of
America’s Most
Admired Companies.
4 Performance at a glance