McDonalds 2000 Annual Report Download - page 32
Download and view the complete annual report
Please find page 32 of the 2000 McDonalds annual report below. You can navigate through the pages in the report by either clicking on the pages listed below, or by using the keyword search tool below to find specific information within the annual report.-
 1
1 -
2
-
3
-
4
-
5
-
6
-
7
-
8
-
9
-
10
-
11
-
12
-
13
-
14
-
15
-
16
-
17
-
18
-
19
-
20
-
21
-
 22
22 -
 23
23 -
 24
24 -
 25
25 -
 26
26 -
 27
27 -
 28
28 -
 29
29 -
 30
30 -
 31
31 -
 32
32 -
 33
33 -
 34
34 -
 35
35 -
 36
36 -
 37
37 -
 38
38 -
 39
39 -
 40
40 -
 41
41 -
 42
42 -
43
-
44
-
45
-
46
-
47
-
48
-
49
-
50
-
51
-
52
 |
 |

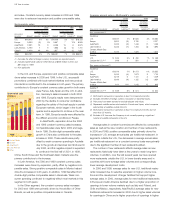
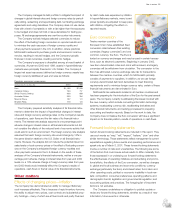
Europe’s operating income increased 6% in 2000 and 12% in
1999 in constant currencies, accounting for more than 35% of
consolidated operating income in both years. The increase in 2000
was primarily driven by strong operating results in France, Italy and
Spain. In 1999, Europe’s operating income growth benefited from
the consolidation of Sweden, as well as strong results in France,
Germany, Spain and the U.K. Europe’s results were dampened in
2000 by the decline in consumer confidence regarding the safety
of the beef supply in certain European markets, which began in the
fourth quarter, and in 1999 by the difficult economic conditions in
Russia. France, Germany and the U.K. accounted for about 75%
of Europe’s operating income in 2000, 1999 and 1998.
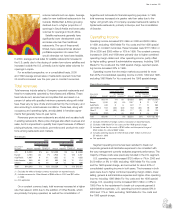
Asia/Pacific’s operating income increased 6% in 2000 and 10% in
1999 in constant currencies. The increases in both years were driven
primarily by Japan, which benefited from the partial sale of its owner-
ship in Toys ‘R’ Us Japan in 2000 and a
lower effective tax rate in 1999, as well as
strong results in China and South Korea.
In addition, Taiwan contributed to the
increase in 2000 but tempered the seg-
ment’s results in 1999, due to the effect
of the September 1999 earthquake.
Results in 2000 were negatively affected
by the introduction of the goods and
services tax in Australia in July 2000.
Australia and Japan accounted for more
than 60% of Asia/Pacific’s operating
income in 2000, 1999 and 1998.
Beginning January 1, 2001, this segment will benefit from an increase
in the royalty percent received from our Japanese affiliate.
Latin America’s operating income decreased 23% in 2000 and
9% in 1999 in constant currencies. Results in both years were nega-
tively impacted by the difficult economic conditions experienced by
most markets in the segment. Partly offsetting the decreases were
strong performances in Mexico and Venezuela in both years, as well
as the consolidation of Argentina in 2000. Brazil accounted for more
than 55% of Latin America’s operating income in each of the past
three years.
Corporate general & administrative expenses benefited in 2000,
1999 and 1998 from savings resulting from the home office produc-
tivity initiative.
Operating margins
Operating margin information and discussions relate to McDonald’s
restaurants only and exclude Other Brands.
Company-operated margins
Company-operated margin dollars are equal to sales by Company-
operated restaurants less the operating costs of these restaurants.
Company-operated margin dollars declined $4 million in 2000, com-
pared with a $40 million increase in 1999. In constant currencies,
Company-operated margin dollars increased $73 million or 4% in
2000 and $88 million or 5% in 1999. The constant currency increases
were primarily driven by expansion and positive comparable sales.
Company-operated margins were 16.9% of sales in 2000, 17.7%
in 1999 and 18.4% in 1998. Operating cost trends as a percent of
sales were as follows: food & paper costs increased in 2000 and were
flat in 1999; payroll costs were flat in 2000 and increased in 1999; and
occupancy & other operating expenses increased in both years.
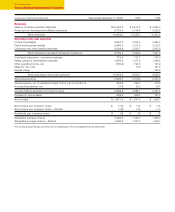
Company-operated margins—McDonald’s restaurants
IN MILLIONS 2000 1999 1998
U.S. $ 521 $ 516 $ 490
Europe 683 743 703
Asia/Pacific 289 267 242
Latin America 95 70 118
Canada, Middle East & Africa 82 78 81
Total $1,670 $1,674 $1,634
PERCENT OF SALES
U.S. 17.0% 17.5% 17.3%
Europe 18.3 19.2 20.0
Asia/Pacific 16.2 16.6 16.9
Latin America 12.4 14.1 19.1
Canada, Middle East & Africa 14.5 14.9 16.0
Total 16.9% 17.7% 18.4%
In the U.S., food & paper costs were lower as a percent of sales
in 2000 and 1999, primarily due to less waste (partly as a result of
the implementation of our Made For You food preparation system),
and payroll costs were higher in both years as a result of higher
average hourly rates. Occupancy & other operating expenses were
higher in 2000 than 1999 and lower in
1999 than 1998.
Europe’s Company-operated margin
percent declined in 2000 as all costs
increased as a percent of sales. The
difficult economic conditions in Russia
accounted for more than half of the
decline in Europe’s margin percent in
1999.
In Asia/Pacific, weak comparable
sales in both years negatively affected
Company-operated margins as a percent
of sales. The September 1999 earth-
quake in Taiwan, as well as a difficult comparison due to strong
1998 promotions in Hong Kong contributed to Asia/Pacific’s 1999
decline. In Latin America, the margin percent declines were due to
difficult economic conditions in most markets and negative compa-
rable sales in both years.
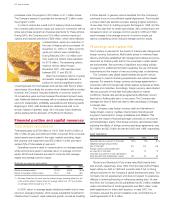
Franchised margins
Franchised margin dollars are equal to revenues from franchised and
affiliated restaurants less the Company’s occupancy costs (rent and
depreciation) associated with those sites. Franchised margin dollars
represented more than 60% of the combined operating margins in
2000, 1999 and 1998. Franchised margin dollars declined $6 million
in 2000, compared with a $160 million increase in 1999. In constant
currencies, franchised margin dollars increased $119 million or 4% in
2000 and $220 million or 8% in 1999, primarily driven by expansion
and positive comparable sales.
30 Year in review