McDonalds 2000 Annual Report Download - page 7
Download and view the complete annual report
Please find page 7 of the 2000 McDonalds annual report below. You can navigate through the pages in the report by either clicking on the pages listed below, or by using the keyword search tool below to find specific information within the annual report.-
 1
1 -
 2
2 -
 3
3 -
 4
4 -
 5
5 -
 6
6 -
 7
7 -
 8
8 -
 9
9 -
 10
10 -
 11
11 -
 12
12 -
 13
13 -
 14
14 -
 15
15 -
 16
16 -
 17
17 -
 18
18 -
19
-
20
-
21
-
22
-
23
-
24
-
25
-
26
-
27
-
28
-
29
-
30
-
31
-
32
-
33
-
34
-
35
-
36
-
37
-
38
-
39
-
40
-
41
-
42
-
43
-
44
-
45
-
46
-
47
-
48
-
49
-
50
-
51
-
52
 |
 |

Performance at a glance 5
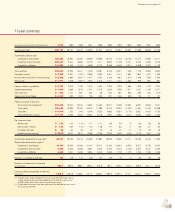
11-year summary
DOLLARS IN MILLIONS, EXCEPT PER SHARE DATA
2000 1999 1998 1997 1996 1995 1994 1993 1992 1991 1990
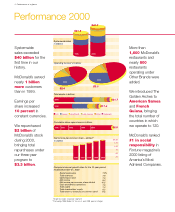
Systemwide sales $40,181 38,491 35,979 33,638 31,812 29,914 25,987 23,587 21,885 19,928 18,759
Systemwide sales by type
Operated by franchisees $24,463 23,830 22,330 20,863 19,969 19,123 17,146 15,756 14,474 12,959 12,017
Operated by the Company $10,467 9,512 8,895 8,136 7,571 6,863 5,793 5,157 5,103 4,908 5,019
Operated by affiliates $ 5,251 5,149 4,754 4,639 4,272 3,928 3,048 2,674 2,308 2,061 1,723
Total revenues $14,243 13,259 12,421 11,409 10,687 9,795 8,321 7,408 7,133 6,695 6,640
Operating income $ 3,330 3,320 2,762
(1)
2,808 2,633 2,601 2,241 1,984 1,862 1,679 1,596
Income before provision for income taxes $ 2,882 2,884 2,307
(1)
2,407 2,251 2,169 1,887 1,676 1,448 1,299 1,246
Net income $ 1,977 1,948 1,550
(1)
1,642 1,573 1,427 1,224 1,083 959 860 802
Cash provided by operations $ 2,751 3,009 2,766 2,442 2,461 2,296 1,926 1,680 1,426 1,423 1,301
Capital expenditures $ 1,945 1,868 1,879 2,111 2,375 2,064 1,539 1,317 1,087 1,129 1,571
Free cash flow $ 806 1,141 887 331 86 232 387 363 339 294 (270)
Treasury stock purchases $ 2,002 933 1,162 765 605 321 500 628 92 117 157
Financial position at year end
Net property and equipment $17,048 16,324 16,042 14,961 14,352 12,811 11,328 10,081 9,597 9,559 9,047
Total assets $21,684 20,983 19,784 18,242 17,386 15,415 13,592 12,035 11,681 11,349 10,668
Total debt $ 8,474 7,252 7,043 6,463 5,523 4,836 4,351 3,713 3,857 4,615 4,792
Total shareholders’ equity $ 9,204 9,639 9,465 8,852 8,718 7,861 6,885 6,274 5,892 4,835 4,182
Per common share
Net income $ 1.49 1.44 1.14
(1)
1.17 1.11 .99 .84 .73 .65 .59 .55
Net income—diluted $ 1.46 1.39 1.10
(1)
1.15 1.08 .97 .82 .71 .63 .57 .54
Dividends declared $ .22 .20 .18 .16 .15 .13 .12 .11 .10 .09 .09
Market price at year end $ 34.00 40.31 38.41 23.88 22.69 22.56 14.63 14.25 12.19 9.50 7.25
Systemwide restaurants at year end
(2)
28,707 26,309 24,513 22,928 20,884 18,299 15,899 14,127 13,093 12,418 11,803
Systemwide restaurants by type
(2)
Operated by franchisees 16,795 15,949 15,086 14,197 13,374 12,186 10,944 9,918 9,237 8,735 8,131
Operated by the Company 7,652 6,059 5,433 4,887 4,294 3,783 3,216 2,733 2,551 2,547 2,643
Operated by affiliates 4,260 4,301 3,994 3,844 3,216 2,330 1,739 1,476 1,305 1,136 1,029
Number of countries at year end 120 118 114 109 101 89 79 70 65 59 53
Number of shareholders at year end
IN THOUSANDS
953.1 899.5 888.2 880.2 904.6 769.7 609.2 464.5 398.3 371.7 362.6
Common shares outstanding at year end
IN MILLIONS
1,304.9 1,350.8 1,356.2 1,371.4 1,389.2 1,399.5 1,387.4 1,414.7 1,454.1 1,434.5 1,436.4
(1) Includes $162 million of Made For You costs and the $160 million special
charge related to the home office productivity initiative for a pretax total
of $322 million ($219 million after tax or $0.16 per share).
(2) Systemwide restaurants have been adjusted to exclude dessert-only kiosks
for all years presented.