McDonalds 2000 Annual Report Download - page 39
Download and view the complete annual report
Please find page 39 of the 2000 McDonalds annual report below. You can navigate through the pages in the report by either clicking on the pages listed below, or by using the keyword search tool below to find specific information within the annual report.-
 1
1 -
2
-
3
-
4
-
5
-
6
-
7
-
8
-
9
-
10
-
11
-
12
-
13
-
14
-
15
-
16
-
17
-
18
-
19
-
20
-
21
-
22
-
23
-
24
-
25
-
26
-
27
-
28
-
 29
29 -
 30
30 -
 31
31 -
 32
32 -
 33
33 -
 34
34 -
 35
35 -
 36
36 -
 37
37 -
 38
38 -
 39
39 -
 40
40 -
 41
41 -
 42
42 -
 43
43 -
 44
44 -
 45
45 -
 46
46 -
 47
47 -
 48
48 -
 49
49 -
50
-
51
-
52
 |
 |

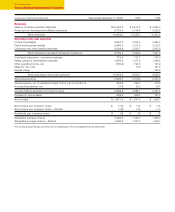
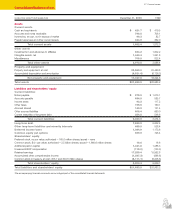
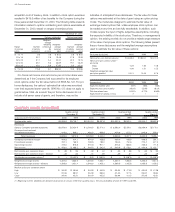
Consolidated balance sheet
IN MILLIONS, EXCEPT PER SHARE DATA December 31, 2000 1999
Assets
Current assets
Cash and equivalents $ 421.7 $ 419.5
Accounts and notes receivable 796.5 708.1
Inventories, at cost, not in excess of market 99.3 82.7
Prepaid expenses and other current assets 344.9 362.0
Total current assets 1,662.4 1,572.3
Other assets
Investments in and advances to affiliates 824.2 1,002.2
Intangible assets, net 1,443.4 1,261.8
Miscellaneous 705.9 822.4
Total other assets 2,973.5 3,086.4
Property and equipment
Property and equipment, at cost 23,569.0 22,450.8
Accumulated depreciation and amortization (6,521.4) (6,126.3)
Net property and equipment 17,047.6 16,324.5
Total assets $21,683.5 $20,983.2
Liabilities and shareholders’ equity
Current liabilities
Notes payable $ 275.5 $ 1,073.1
Accounts payable 684.9 585.7
Income taxes 92.2 117.2
Other taxes 195.5 160.1
Accrued interest 149.9 131.4
Other accrued liabilities 608.4 660.0
Current maturities of long-term debt 354.5 546.8
Total current liabilities 2,360.9 3,274.3
Long-term debt 7,843.9 5,632.4
Other long-term liabilities and minority interests 489.5 538.4
Deferred income taxes 1,084.9 1,173.6
Common equity put options 699.9 725.4
Shareholders’ equity
Preferred stock, no par value; authorized—165.0 million shares; issued—none
Common stock, $.01 par value; authorized—3.5 billion shares; issued—1,660.6 million shares 16.6 16.6
Additional paid-in capital 1,441.8 1,288.3
Unearned ESOP compensation (115.0) (133.3)
Retained earnings 17,259.4 15,562.8
Accumulated other comprehensive income (1,287.3) (886.8)
Common stock in treasury, at cost; 355.7 and 309.8 million shares (8,111.1) (6,208.5)
Total shareholders’ equity 9,204.4 9,639.1
Total liabilities and shareholders’ equity $21,683.5 $20,983.2
The accompanying financial comments are an integral part of the consolidated financial statements.
37 Financial review