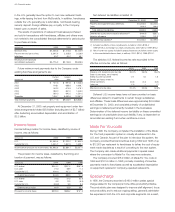
McDonalds 2000 Annual Report Download - page 41
Download and view the complete annual report
Please find page 41 of the 2000 McDonalds annual report below. You can navigate through the pages in the report by either clicking on the pages listed below, or by using the keyword search tool below to find specific information within the annual report.-
 1
1 -
2
-
3
-
4
-
5
-
6
-
7
-
8
-
9
-
10
-
11
-
12
-
13
-
14
-
15
-
16
-
17
-
18
-
19
-
20
-
21
-
22
-
23
-
24
-
25
-
26
-
27
-
28
-
29
-
30
-
 31
31 -
 32
32 -
 33
33 -
 34
34 -
 35
35 -
 36
36 -
 37
37 -
 38
38 -
 39
39 -
 40
40 -
 41
41 -
 42
42 -
 43
43 -
 44
44 -
 45
45 -
 46
46 -
 47
47 -
 48
48 -
 49
49 -
 50
50 -
 51
51 -
52
 |
 |

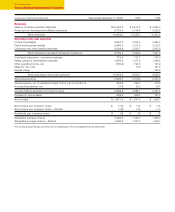
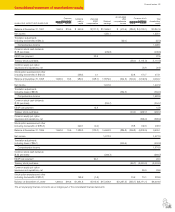
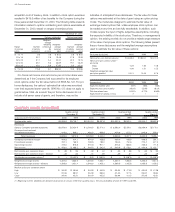
Consolidated statement of shareholders’ equity
Financial review 39
Accumulated
Common Additional Unearned other Common stock Total
stock issued paid-in ESOP Retained comprehensive in treasury shareholders’
IN MILLIONS, EXCEPT PER SHARE DATA
Shares Amount capital compensation earnings income Shares Amount equity
Balance at December 31, 1997 1,660.6 $16.6 $ 690.9 $(171.3) $12,569.0 $ (470.5) (289.2) $ (3,783.1) $ 8,851.6
Net income 1,550.1 1,550.1
Translation adjustments
(including tax benefits of $84.2) (52.0) (52.0)
Comprehensive income 1,498.1
Common stock cash dividends
($.18 per share) (239.5) (239.5)
ESOP loan payment 22.5 22.5
Treasury stock purchases (38.0) (1,161.9) (1,161.9)
Common equity put option
issuances and expirations, net 20.8 20.8
Stock option exercises and other
(including tax benefits of $154.0) 298.3 0.1 22.8 174.7 473.1
Balance at December 31, 1998 1,660.6 16.6 989.2 (148.7) 13,879.6 (522.5) (304.4) (4,749.5) 9,464.7
Net income 1,947.9 1,947.9
Translation adjustments
(including taxes of $53.5) (364.3) (364.3)
Comprehensive income 1,583.6
Common stock cash dividends
($.20 per share) (264.7) (264.7)
ESOP loan payment 15.8 15.8
Treasury stock purchases (24.2) (932.7) (932.7)
Common equity put option
issuances and expirations, net (665.9) (665.9)
Stock option exercises and other
(including tax benefits of $185.3) 299.1 (0.4) 18.8 139.6 438.3
Balance at December 31, 1999 1,660.6 16.6 1,288.3 (133.3) 15,562.8 (886.8) (309.8) (6,208.5) 9,639.1
Net income
1,977.3 1,977.3
Translation adjustments
(including taxes of $65.1)
(400.5) (400.5)
Comprehensive income
1,576.8
Common stock cash dividends
($.22 per share)
(280.7) (280.7)
ESOP loan payment
20.1 20.1
Treasury stock purchases
(56.7) (2,002.2) (2,002.2)
Common equity put option
issuances and expirations, net
25.5 25.5
Stock option exercises and other
(including tax benefits of $80.3)
153.5 (1.8) 10.8 74.1 225.8
Balance at December 31, 2000 1,660.6 $16.6 $1,441.8 $(115.0) $17,259.4 $(1,287.3) (355.7) $(8,111.1) $ 9,204.4
The accompanying financial comments are an integral part of the consolidated financial statements.