McDonalds 2000 Annual Report Download - page 31
Download and view the complete annual report
Please find page 31 of the 2000 McDonalds annual report below. You can navigate through the pages in the report by either clicking on the pages listed below, or by using the keyword search tool below to find specific information within the annual report.-
 1
1 -
2
-
3
-
4
-
5
-
6
-
7
-
8
-
9
-
10
-
11
-
12
-
13
-
14
-
15
-
16
-
17
-
18
-
19
-
20
-
 21
21 -
 22
22 -
 23
23 -
 24
24 -
 25
25 -
 26
26 -
 27
27 -
 28
28 -
 29
29 -
 30
30 -
 31
31 -
 32
32 -
 33
33 -
 34
34 -
 35
35 -
 36
36 -
 37
37 -
 38
38 -
 39
39 -
 40
40 -
 41
41 -
42
-
43
-
44
-
45
-
46
-
47
-
48
-
49
-
50
-
51
-
52
 |
 |

volume markets such as Japan. Average
sales for new traditional restaurants in the
Canada, Middle East & Africa grouping
declined due to a higher proportion of
openings in Saudi Arabia and lower sales
volumes for openings in South Africa.
Satellite restaurants generally have
significantly lower development costs
and sales volumes than traditional
restaurants. The use of these small,
limited-menu restaurants has allowed
profitable expansion into areas that
would otherwise not have been feasible.
In 2000, average annual sales for satellite restaurants increased in
the U.S. partly due to the closing of certain low-volume satellites and
increased outside the U.S. primarily due to higher sales volumes for
openings in Japan.
For an added perspective, on a consolidated basis, 2000
and 1999 average annual sales of restaurants opened more than
25 months increased over the prior year in constant currencies.
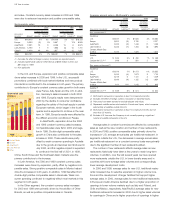
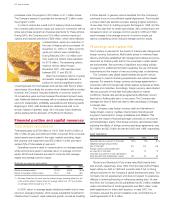
Total revenues
Total revenues include sales by Company-operated restaurants and
fees from restaurants operated by franchisees and affiliates. These
fees include rent, service fees and royalties that are based on a
percent of sales with specified minimum payments along with initial
fees. Fees vary by type of site and investment by the Company, and
also according to local business conditions. These fees, along with
occupancy and operating rights, are stipulated in franchise agree-
ments that generally have 20-year terms.
Revenues grow as new restaurants are added and as sales build
in existing restaurants. Menu price changes also affect revenues and
sales, but it is impractical to quantify their impact because of different
pricing structures, new products, promotions and product-mix varia-
tions among restaurants and markets.
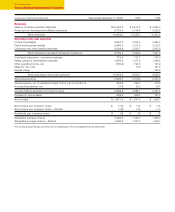
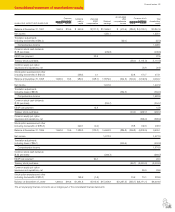
Revenues
2000 1999 1998
Increase/(decrease) Increase/(decrease)
DOLLARS IN
As Constant As Constant
MILLIONS
Amount reported currency
(1)
Amount reported currency
(1)
Amount
U.S. $ 5,259 3% na $ 5,093 5% na $ 4,868
Europe 4,754 (3) 7% 4,925 10 15% 4,467
Asia/Pacific 1,987 8 11 1,832 12 9 1,633
Latin America 949 40 41 680 (16) 10 814
Other
(2)
1,294 78 79 729 14 15 639
Total $14,243 7% 12% $13,259 7% 10% $12,421
(1) Excludes the effect of foreign currency translation on reported results.
(2) Includes revenues for Other Brands of $564 million in 2000 and $57 million
in 1999.
na Not applicable.
On a constant currency basis, total revenues increased at a higher
rate than sales in 2000 due to the addition of Other Brands, which
are primarily Company-operated, as well as the consolidation of
Argentina and Indonesia for financial reporting purposes. In 1999,
total revenues increased at a greater rate than sales due to the
higher unit growth rate of Company-operated restaurants relative to
Systemwide restaurants, primarily in Europe, and the consolidation
of Sweden.
Operating income
Operating income increased $10 million in 2000 and $236 million
in 1999, excluding 1998 Made For You costs and the 1998 special
charge. In constant currencies, these increases were $161 million or
5% in 2000 and $303 million or 10% in 1999. The constant currency
increases in 2000 and 1999 were primarily due to higher combined
operating margin dollars and other operating income, partly offset
by higher selling, general & administrative expenses. Including 1998
Made For You costs and the 1998 special charge, reported operat-
ing income increased 20% in 1999.
Operating income from the major markets accounted for more
than 90% of consolidated operating income in 2000, 1999 and 1998,
excluding 1998 Made For You costs and the 1998 special charge.
Operating income
2000 1999 1998
Increase/(decrease) Increase/(decrease)
DOLLARS IN
As Constant As Constant
MILLIONS
Amount reported currency
(1)
Amount reported currency
(1)
Amount
U.S. $1,773 7% na $1,653 38% 8%
(2)
$1,202
(3)
Europe 1,180 (6) 6% 1,257 8 12 1,167
Asia/Pacific 442 5 6 422 17 10 360
Latin America 103 (23) (23) 133 (30) (9) 189
Other
(4)
94 (20) (20) 117 (3) (2) 120
Corporate (262) –na (262) 5 na (276)
Total $3,330 –5% $3,320 20% 10%
(2)
$2,762
(3)
(1) Excludes the effect of foreign currency translation on reported results.
(2) Excludes 1998 Made For You costs and the 1998 special charge.
(3) Includes Made For You costs of $162 million and the special charge of
$160 million for a total of $322 million.
(4) Includes operating losses for Other Brands of $41 million in 2000 and
$7 million in 1999.
na Not applicable.
Segment operating income has been restated to break out
corporate general & administrative expenses to be consistent with
the way management currently evaluates segment performance. The
majority of these costs were previously included in the U.S. segment.
U.S. operating income increased $120 million or 7% in 2000 and
$129 million or 8% in 1999, excluding 1998 Made For You costs
and the 1998 special charge, and accounted for about 50% of
consolidated operating income in both years. The increases in both
years were due to higher combined operating margin dollars, lower
selling, general & administrative expenses and higher other operating
income. Including 1998 Made For You costs and the 1998 special
charge, U.S. operating income increased $451 million or 38% in
1999. Prior to the restatement to break out corporate general &
administrative expenses, U.S. operating income increased 9% in
2000 and 11% in 1999, excluding 1998 Made For You costs and
the 1998 special charge.
Year in review 29