McDonalds 2000 Annual Report Download - page 35
Download and view the complete annual report
Please find page 35 of the 2000 McDonalds annual report below. You can navigate through the pages in the report by either clicking on the pages listed below, or by using the keyword search tool below to find specific information within the annual report.-
 1
1 -
2
-
3
-
4
-
5
-
6
-
7
-
8
-
9
-
10
-
11
-
12
-
13
-
14
-
15
-
16
-
17
-
18
-
19
-
20
-
21
-
22
-
23
-
24
-
 25
25 -
 26
26 -
 27
27 -
 28
28 -
 29
29 -
 30
30 -
 31
31 -
 32
32 -
 33
33 -
 34
34 -
 35
35 -
 36
36 -
 37
37 -
 38
38 -
 39
39 -
 40
40 -
 41
41 -
 42
42 -
 43
43 -
 44
44 -
 45
45 -
46
-
47
-
48
-
49
-
50
-
51
-
52
 |
 |

in 1998, combined with our decision to lease more land saved the
Company approximately $285 million in capital outlays in 2000 and
$230 million in 1999.
More than 60% of capital expenditures was invested in major
markets excluding Japan in 2000, 1999 and 1998. Approximately
70% of capital expenditures was invested in markets outside the
U.S. in all three years.
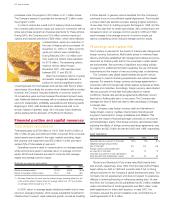
Capital expenditures
IN MILLIONS 2000 1999 1998
New restaurants $ 1,308 $ 1,231 $ 1,357
Existing restaurants 507 515 398
Other properties 130 122 124
Total $ 1,945 $ 1,868 $ 1,879
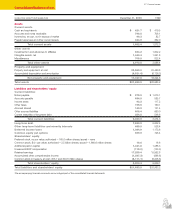
Total assets $21,684 $20,983 $19,784
Expenditures for existing restaurants, including technology to
improve service and food quality and enhancements to older facili-
ties, were made to achieve higher levels of customer satisfaction.
Expenditures for other properties primarily were for computer equip-
ment and furnishings for office buildings.
The Company’s expenditures for new restaurants in the U.S. were
minimal as a result of the building and leasing programs previously
discussed. For new franchised and affiliated restaurants, which repre-
sent about 85% of U.S. restaurants, the Company generally incurs
no capital expenditures. However, the Company maintains long-term
occupancy rights for the land and receives related rental income. For
new Company-operated restaurants, the Company generally leases
the land and owns the restaurant building and equipment.
Average development costs outside the U.S. vary widely by mar-
ket depending on the types of restaurants built and the real estate
and construction costs within each market. These costs, which
include land, buildings and equipment owned by the Company, are
managed through the use of optimally sized restaurants, construc-
tion and design efficiencies, standardization and global sourcing. In
addition, foreign currency fluctuations affect average development
costs, especially in those markets where construction materials can-
not be obtained locally.
Average development costs for new traditional restaurants in
major markets outside the U.S. excluding Japan were approximately
$1.6 million in 2000, $1.8 million in 1999 and $1.9 million in 1998.
Average annual sales for new traditional restaurants for the same
markets were approximately $1.5 million in 2000, $1.7 million in
1999 and $1.8 million in 1998. Both development costs and sales
were impacted by weaker foreign currencies. Average development
costs for new satellite restaurants located in Canada and Japan,
which comprise more than 90% of the satellites outside the U.S.,
were approximately $200,000 in 2000, 1999 and 1998. The use of
these small, limited-menu restaurants, for which the land and build-
ing generally are leased, has allowed expansion into areas that
would otherwise not have been feasible.
Including affiliates, total land ownership was 40% and 42% of
total restaurant sites at year-end 2000 and 1999, respectively.
Capital expenditures by affiliates, which were not included in
consolidated amounts, were approximately $204 million in 2000,
compared with $259 million in 1999. The decrease was primarily
due to the consolidation of Argentina in 2000.
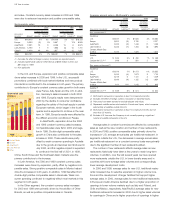
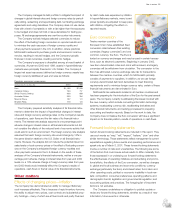
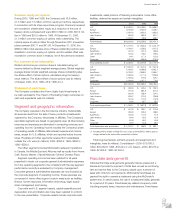
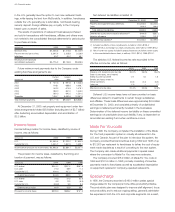
Systemwide restaurants (1)
2000 1999 1998
U.S. 12,804 12,629 12,472
Europe 5,460 4,943 4,421
Asia/Pacific 6,260 5,654 5,055
Latin America 1,510 1,299 1,100
Other:
Canada, Middle East & Africa 1,665 1,568 1,447
Other Brands 1,008 216 18
Total 28,707 26,309 24,513
(1) Adjusted to exclude dessert-only kiosks, primarily located in Latin America,
as follows: 600 in 2000, 497 in 1999 and 305 in 1998.
McDonald’s continues to focus on managing capital outlays
more effectively through selective expansion. In 2000, the Company
added 1,606 McDonald’s restaurants Systemwide, compared with
1,598 in 1999 and 1,567 in 1998. In addition,
the Company added 792 restaurants in 2000
operated by Other Brands, 707 of which were
the result of the Boston Market acquisition.
In 2001, the Company expects to add 1,600
to 1,700 restaurants, including 1,500 to
1,600 McDonald’s restaurants, with continued
emphasis on traditional restaurants located
primarily outside the U.S.
In 2000, 55% of McDonald’s restaurant
additions were in the major markets, and we
anticipate a similar percent for 2001. In the
future, China, Italy, Mexico, South Korea and
Spain, which together represented more than
15% of McDonald’s additions in 2000, are
expected to represent a growing proportion
of McDonald’s restaurant additions.
Almost 55% of Company-operated restau-
rants and nearly 85% of franchised restaurants
were located in the major markets at the end of 2000. Franchisees
and affiliates operated 76% of McDonald’s restaurants at year-end
2000. Other Brands’ restaurants were primarily Company-operated.
Satellite restaurants at December 31, 2000, 1999 and 1998 were
as follows: U.S.–999, 1,048, 1,090; Europe–46, 44, 46; Asia/Pacific
(primarily Japan)–1,670, 1,350, 1,134; Latin America–45, 41, 41;
and Other (primarily Canada)–291, 263, 237.
Share repurchases and dividends
The Company uses free cash flow and credit capacity to repurchase
shares, as we believe this enhances shareholder value. At year-end
2000, the Company held approximately 356 million shares in treasury
with a historical cost of $8.1 billion, but a market value of $12.1 billion.
In April 2000, the Company announced a $1 billion increase to its
three-year share repurchase program, bringing the total program to
$4.5 billion through 2001. The Company purchased approximately
$2 billion or 56.7 million shares in 2000, which brought cumulative
Year in review 33
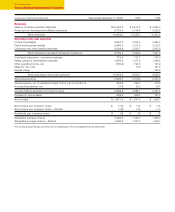
Systemwide restaurants
in thousands
30
25
20
15
10
5
20001996
United States
Europe
Asia/Pacific
Latin America
Other