McDonalds 2000 Annual Report Download - page 44
Download and view the complete annual report
Please find page 44 of the 2000 McDonalds annual report below. You can navigate through the pages in the report by either clicking on the pages listed below, or by using the keyword search tool below to find specific information within the annual report.-
 1
1 -
2
-
3
-
4
-
5
-
6
-
7
-
8
-
9
-
10
-
11
-
12
-
13
-
14
-
15
-
16
-
17
-
18
-
19
-
20
-
21
-
22
-
23
-
24
-
25
-
26
-
27
-
28
-
29
-
30
-
31
-
32
-
33
-
 34
34 -
 35
35 -
 36
36 -
 37
37 -
 38
38 -
 39
39 -
 40
40 -
 41
41 -
 42
42 -
 43
43 -
 44
44 -
 45
45 -
 46
46 -
 47
47 -
 48
48 -
 49
49 -
 50
50 -
 51
51 -
 52
52
 |
 |

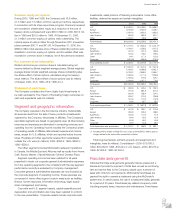
in the U.S. generally have the option to own new restaurant build-
ings, while leasing the land from McDonald’s. In addition, franchisees
outside the U.S. generally pay a refundable, noninterest-bearing
security deposit. Foreign affiliates pay a royalty to the Company
based upon a percent of sales.
The results of operations of restaurant businesses purchased
and sold in transactions with franchisees, affiliates and others were
not material to the consolidated financial statements for periods prior
to purchase and sale.
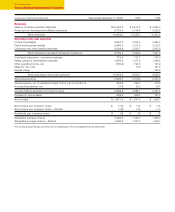
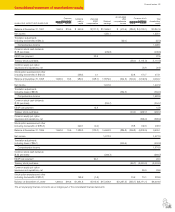
IN MILLIONS 2000 1999 1998
Minimum rents $1,465.3 $1,473.8 $1,440.9
Percent rent and service fees 2,247.0 2,208.8 2,026.9
Initial fees 63.7 64.2 58.7
Revenues from franchised
and affiliated restaurants $3,776.0 $3,746.8 $3,526.5
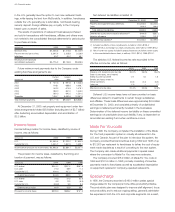
Future minimum rent payments due to the Company under
existing franchise arrangements are:
Owned Leased
IN MILLIONS sites sites Total
2001 $ 927.5 $ 697.8 $ 1,625.3
2002 918.1 688.6 1,606.7
2003 902.2 675.9 1,578.1
2004 884.0 661.0 1,545.0
2005 861.0 640.0 1,501.0
Thereafter 7,284.7 5,682.6 12,967.3
Total minimum payments $11,777.5 $9,045.9 $20,823.4
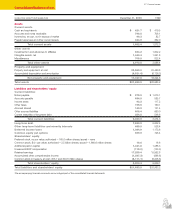
At December 31, 2000, net property and equipment under fran-
chise arrangements totaled $8.9 billion (including land of $2.7 billion)
after deducting accumulated depreciation and amortization of
$3.3 billion.
Income taxes
Income before provision for income taxes, classified by source of
income, was as follows:
IN MILLIONS 2000 1999 1998
U.S. $1,280.6 $1,222.2 $ 804.3
Outside the U.S. 1,601.7 1,661.9 1,503.1
Income before provision for income taxes $2,882.3 $2,884.1 $2,307.4
The provision for income taxes, classified by the timing and
location of payment, was as follows:
IN MILLIONS 2000 1999 1998
U.S. federal $361.1 $347.4 $267.8
U.S. state 77.0 68.9 71.4
Outside the U.S. 406.4 467.0 382.7
Current tax provision 844.5 883.3 721.9
U.S. federal 75.2 31.3 32.8
U.S. state 9.5 12.3 (6.9)
Outside the U.S. (24.2) 9.3 9.5
Deferred tax provision 60.5 52.9 35.4
Provision for income taxes $905.0 $936.2 $757.3
Net deferred tax liabilities consisted of:
IN MILLIONS December 31, 2000 1999
Property and equipment basis differences $1,202.6 $1,200.0
Other 353.3 396.3
Total deferred tax liabilities 1,555.9 1,596.3
Deferred tax assets before valuation allowance(1) (646.9) (658.7)
Valuation allowance 124.0 101.9
Net deferred tax liabilities(2) $1,033.0 $1,039.5
(1) Includes tax effects of loss carryforwards (in millions): 2000–$129.4;
1999–$118.3, and foreign tax credit carryforwards: 2000–$41.2; 1999–$70.2.
(2) Net of current tax assets included in prepaid expenses and other current assets
in the consolidated balance sheet (in millions): 2000–$51.9; 1999–$134.1.
The statutory U.S. federal income tax rate reconciled to the
effective income tax rates as follows:
2000 1999 1998
Statutory U.S. federal income tax rate 35.0% 35.0% 35.0%
State income taxes, net of related
federal income tax benefit 1.9 1.8 1.8
Benefits and taxes related to
foreign operations (4.8) (4.4) (3.3)
Other, net (.7) .1 (.7)
Effective income tax rates 31.4% 32.5% 32.8%
Deferred U.S. income taxes have not been provided on basis
differences related to investments in certain foreign subsidiaries
and affiliates. These basis differences were approximately $2.5 billion
at December 31, 2000, and consisted primarily of undistributed
earnings considered permanently invested in the businesses.
Determination of the deferred income tax liability on these unremitted
earnings is not practicable since such liability, if any, is dependent on
circumstances existing if and when remittance occurs.
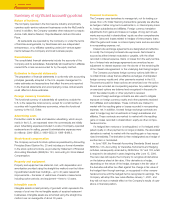
Made For You costs
During 1999, the Company completed the installation of the Made
For You food preparation system in virtually all restaurants in the
U.S. and Canada. As part of the plan to introduce this system, the
Company provided financial incentives during 1999 and 1998 of up
to $12,500 per restaurant to franchisees to defray the cost of equip-
ment made obsolete as a result of converting to the new system.
The Company also made additional payments in special cases
where the conversion to Made For You was more extensive.
The Company incurred $18.9 million of Made For You costs in
1999 and $161.6 million in 1998, primarily consisting of incentive
payments made to franchisees as well as accelerated depreciation
on equipment replaced in Company-operated restaurants.
Special charge
In 1998, the Company recorded a $160.0 million pretax special
charge related to the Company’s home office productivity initiative.
The productivity plan was designed to improve staff alignment, focus
and productivity and to reduce ongoing selling, general & administra-
tive expenses in both the U.S. and corporate segments. As a result,
42 Financial review