McDonalds 2000 Annual Report Download - page 48
Download and view the complete annual report
Please find page 48 of the 2000 McDonalds annual report below. You can navigate through the pages in the report by either clicking on the pages listed below, or by using the keyword search tool below to find specific information within the annual report.-
 1
1 -
2
-
3
-
4
-
5
-
6
-
7
-
8
-
9
-
10
-
11
-
12
-
13
-
14
-
15
-
16
-
17
-
18
-
19
-
20
-
21
-
22
-
23
-
24
-
25
-
26
-
27
-
28
-
29
-
30
-
31
-
32
-
33
-
34
-
35
-
36
-
37
-
 38
38 -
 39
39 -
 40
40 -
 41
41 -
 42
42 -
 43
43 -
 44
44 -
 45
45 -
 46
46 -
 47
47 -
 48
48 -
 49
49 -
 50
50 -
 51
51 -
 52
52
 |
 |

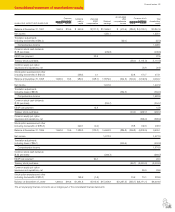
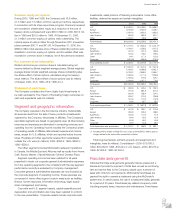
acquisition cost of treasury stock. In addition, stock option exercises
resulted in $419.6 million of tax benefits for the Company during the
three years ended December 31, 2000. The following table presents
information related to options outstanding and options exercisable at
December 31, 2000, based on ranges of exercise prices.
December 31, 2000
Options outstanding Options exercisable
Weighted-
average
remaining Weighted- Weighted-
Range Number contractual average Number average
of exercise of options life exercise of options exercise
prices
IN MILLIONS IN YEARS
price
IN MILLIONS
price
$ 7 to 9 3.8 0.8 $ 8.02 3.8 $ 8.02
10 to 15 32.1 2.6 13.48 27.9 13.26
16 to 23 37.1 5.4 20.40 22.2 19.75
24 to 34 53.7 6.5 25.59 19.1 25.26
35 to 46 49.1 8.9 37.86 6.3 40.44
$ 7 to 46 175.8 6.1 $25.34 79.3 $19.86
Pro forma net income and net income per common share were
determined as if the Company had accounted for its employee
stock options under the fair value method of SFAS No.123. For pro
forma disclosures, the options’ estimated fair value was amortized
over their expected seven-year life. SFAS No.123 does not apply to
grants before 1995. As a result, the pro forma disclosures do not
include a full seven years of grants, and therefore, may not be
indicative of anticipated future disclosures. The fair value for these
options was estimated at the date of grant using an option pricing
model. The model was designed to estimate the fair value of
exchange-traded options that, unlike employee stock options, can
be traded at any time and are fully transferable. In addition, such
models require the input of highly subjective assumptions, including
the expected volatility of the stock price. Therefore, in management’s
opinion, the existing models do not provide a reliable single measure
of the value of employee stock options. The following tables present
the pro forma disclosures and the weighted-average assumptions
used to estimate the fair value of these options:
Pro forma disclosures 2000 1999 1998
Net income—pro forma IN MILLIONS $1,842.4 $1,844.0 $1,474.0
Net income per common share—
pro forma
Basic 1.39 1.36 1.08
Diluted 1.36 1.31 1.05
Weighted-average fair value
per option granted 14.11 14.06 8.75
Assumptions 2000 1999 1998
Expected dividend yield .65% .65% .65%
Expected stock price volatility 38.8% 22.9% 18.0%
Risk-free interest rate 6.39% 5.72% 5.56%
Expected life of options IN YEARS 777
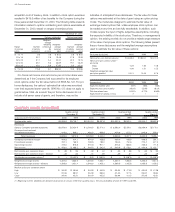
46 Financial review
Quarterly results (unaudited)
Quarters ended Quarters ended Quarters ended Quarters ended
December 31 September 30 June 30 March 31
IN MILLIONS, EXCEPT PER SHARE DATA 2000 1999 2000 1999 2000 1999 2000 1999
Systemwide sales $9,924.5 $9,749.7 $10,512.4 $9,997.8 $10,237.6 $9,920.4 $9,506.7 $8,822.8
Revenues
Sales by Company-operated restaurants $2,676.6 $2,424.9 $ 2,768.5 $2,474.4 $ 2,582.0 $2,434.1 $2,439.9 $2,179.1
Revenues from franchised
and affiliated restaurants 913.0 948.0 980.5 969.8 978.6 973.0 903.9 856.0
Total revenues 3,589.6 3,372.9 3,749.0 3,444.2 3,560.6 3,407.1 3,343.8 3,035.1
Company-operated margin 404.2 414.1 470.9 458.8 435.0 448.9 406.8 361.1
Franchised margin 721.1 756.3 788.5 783.0 784.0 792.6 710.1 677.2
Operating income 774.0 816.8 910.8 907.7 876.3 883.5 768.6 711.6
Net income $ 452.0 $ 486.2 $ 548.5 $ 540.9 $ 525.9 $ 518.1 $ 450.9 $ 402.7
Net income per common share $ .35 $.36 $ .42 $.40 $ .40 $.38 $ .34 $ .30
Net income per common share—diluted .34 .35 .41 .39 .39 .37 .33 .29
Dividends per common share (1) $
–
$ .04875 $ .215 $ .04875 $
–
$ .04875 $
–
$ .04875
Weighted-average shares 1,307.0 1,353.3 1,315.6 1,354.7 1,327.1 1,355.5 1,343.4 1,357.3
Weighted-average shares—diluted 1,335.8 1,401.4 1,346.0 1,403.1 1,365.5 1,405.6 1,383.8 1,409.2
Market price per common share
High $ 34.50 $ 49.56 $ 34.25 $ 45.25 $ 39.94 $ 47.06 $ 43.63 $ 47.38
Low 27.56 38.31 26.38 38.94 31.00 37.75 29.81 35.94
Close 34.00 40.31 30.19 43.25 32.94 41.13 37.38 45.31
(1) Beginning in 2000, dividends are declared and paid on an annual, rather than quarterly, basis. The annual dividend amount for 1999 was $ .195.