McDonalds 2000 Annual Report Download - page 36
Download and view the complete annual report
Please find page 36 of the 2000 McDonalds annual report below. You can navigate through the pages in the report by either clicking on the pages listed below, or by using the keyword search tool below to find specific information within the annual report.-
 1
1 -
2
-
3
-
4
-
5
-
6
-
7
-
8
-
9
-
10
-
11
-
12
-
13
-
14
-
15
-
16
-
17
-
18
-
19
-
20
-
21
-
22
-
23
-
24
-
25
-
 26
26 -
 27
27 -
 28
28 -
 29
29 -
 30
30 -
 31
31 -
 32
32 -
 33
33 -
 34
34 -
 35
35 -
 36
36 -
 37
37 -
 38
38 -
 39
39 -
 40
40 -
 41
41 -
 42
42 -
 43
43 -
 44
44 -
 45
45 -
 46
46 -
47
-
48
-
49
-
50
-
51
-
52
 |
 |

purchases under the program to $3.3 billion or 91.1 million shares.
The Company expects to purchase the remaining $1.2 billion under
the program in 2001.
In order to reduce the overall cost of treasury stock purchases,
the Company sells common equity put options in connection with its
share repurchase program and receives premiums for these options.
During 2000, the Company sold 16.8 million common equity put
options and received premiums of $56 million, which were reflected
in shareholders’ equity as a reduction of
the cost of treasury stock purchased. At
December 31, 2000, 21 million common
equity put options were outstanding.
During February 2001, 4.2 million com-
mon equity put options were exercised
for $175 million. The remaining options
expire at various dates through
November 2001, with exercise prices
between $30.11 and $32.26.
Given the Company’s returns on equity
and assets, management believes it is
prudent to reinvest a significant portion
of earnings back into the business and use free cash flow for share
repurchases. Accordingly, the common stock dividend yield is modest.
However, the Company has paid dividends on common stock for
25 consecutive years and has increased the dividend amount every
year. Additional dividend increases will be considered after reviewing
returns to shareholders, profitability expectations and financing needs.
Beginning in 2000, cash dividends are declared and paid on an
annual, instead of quarterly, basis. As in the past, future dividends
will be declared at the discretion of the Board of Directors.
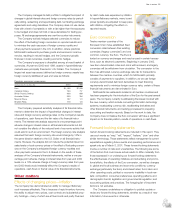
Financial position and capital resources
Total assets and returns
Total assets grew by $700 million or 3% in 2000 and $1.2 billion or
6% in 1999. At year-end 2000 and 1999, more than 65% of consoli-
dated assets were located in the major markets excluding Japan.
Net property and equipment rose $723 million in 2000 and repre-
sented 79% of total assets at year end.
Operating income is used to compute return on average assets,
while net income is used to calculate return on average common
equity. Month-end balances are used to compute both average
assets and average common equity.
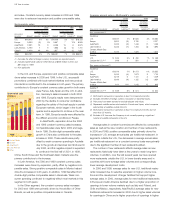
Returns on assets and equity
2000 1999 1998(1)
Return on average assets 15.9% 16.6% 16.4%
Return on average common equity 21.6 20.8 19.5
(1) Excludes Made For You costs and the special charge. Including Made For You
costs and the special charge, return on average assets was 14.7% and return
on average common equity was 17.1%.
In 2000, return on average assets declined primarily due to lower
returns in emerging markets, which require substantial investment in
infrastructure to support rapid restaurant growth, as well as investing
in Other Brands. In general, returns benefited from the Company’s
continued focus on more efficient capital deployment. This included
a more prudent site selection process, leasing a higher proportion
of new sites, the U.S. building program that began in 1998, and the
use of free cash flow for share repurchases. Also contributing to the
increases in return on average common equity in 2000 and 1999
were increases in the average amount of common equity put
options outstanding, which reduced average common equity.
Financings and market risk
The Company is exposed to the impact of interest-rate changes and
foreign currency fluctuations. McDonald’s strives to minimize these
risks by employing established risk management policies and proce-
dures and by financing with debt in the currencies in which assets
are denominated. See summary of significant accounting policies
on page 40 for additional information regarding the use of financial
instruments and the impact of new accounting rules on derivatives.
The Company uses global capital markets along with various
techniques to meet its financing requirements and reduce interest
expense. For example, foreign currency exchange agreements in
conjunction with borrowings help obtain desired currencies at attrac-
tive rates and maturities. Accordingly, foreign currency-denominated
debt as a percent of total debt fluctuates based on market
conditions. Interest-rate exchange agreements effectively convert
fixed-rate to floating-rate debt, or vice versa. The Company also
manages the level of fixed-rate debt to take advantage of changes
in interest rates.
The Company uses foreign currency debt and derivatives to
hedge foreign currency royalties, intercompany financings and
long-term investments in foreign subsidiaries and affiliates. This
reduces the impact of fluctuating foreign currencies on net income
and shareholders’ equity. Total foreign currency-denominated debt,
including the effects of foreign currency exchange agreements, was
$5.1 billion and $5.3 billion at year-end 2000 and 1999, respectively.
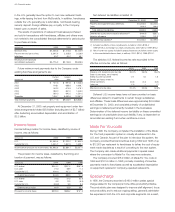
Debt highlights
2000 1999 1998
Fixed-rate debt as a percent of total debt 58% 70% 67%
Weighted-average annual interest
rate of total debt 5.8 5.9 6.6
Foreign currency-denominated debt
as a percent of total debt 60 76 75
Total debt as a percent of total capitalization
(total debt and total shareholders’ equity) 48 43 43
Moody’s and Standard & Poor’s have rated McDonald’s debt
Aa2 and AA, respectively, since 1982. Fitch (formerly Duff & Phelps)
began rating our debt in 1990 and currently rates it AA. A strong
rating is important to the Company’s global development plans. The
Company has not experienced, and does not expect to experience,
difficulty in obtaining financing or refinancing existing debt. At year-
end 2000, the Company and its subsidiaries had $1.9 billion available
under committed line of credit agreements and $561 million under
shelf registrations for future debt issuance. In early 2001, the
Company reduced the amount available under committed line of
credit agreements to $1.5 billion.
34 Year in review