McDonalds 2000 Annual Report Download - page 33
Download and view the complete annual report
Please find page 33 of the 2000 McDonalds annual report below. You can navigate through the pages in the report by either clicking on the pages listed below, or by using the keyword search tool below to find specific information within the annual report.-
 1
1 -
2
-
3
-
4
-
5
-
6
-
7
-
8
-
9
-
10
-
11
-
12
-
13
-
14
-
15
-
16
-
17
-
18
-
19
-
20
-
21
-
22
-
 23
23 -
 24
24 -
 25
25 -
 26
26 -
 27
27 -
 28
28 -
 29
29 -
 30
30 -
 31
31 -
 32
32 -
 33
33 -
 34
34 -
 35
35 -
 36
36 -
 37
37 -
 38
38 -
 39
39 -
 40
40 -
 41
41 -
 42
42 -
 43
43 -
44
-
45
-
46
-
47
-
48
-
49
-
50
-
51
-
52
 |
 |

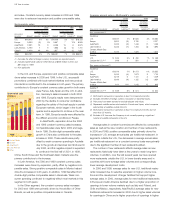
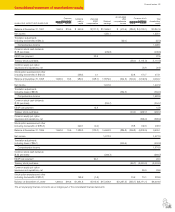
Franchised margins—McDonald’s restaurants
IN MILLIONS 2000 1999 1998
U.S. $1,765 $1,730 $1,650
Europe 802 828 758
Asia/Pacific 173 187 173
Latin America 135 144 155
Canada, Middle East & Africa 127 119 112
Total $3,002 $3,008 $2,848
PERCENT OF REVENUES
U.S. 80.4% 81.0% 80.9%
Europe 78.3 79.0 80.0
Asia/Pacific 82.7 83.6 84.3
Latin America 73.0 77.5 79.7
Canada, Middle East & Africa 78.9 78.5 80.2
Total 79.5% 80.3% 80.8%
The declines in the consolidated margin percent in 2000 and
1999 reflected higher occupancy costs due to an increased number
of leased sites in all geographic segments. Our strategy of leasing a
higher proportion of new sites over the past few years has reduced
initial capital requirements and related interest expense. However, as
anticipated, franchised margins as a percent of applicable revenues
have been negatively impacted because financing costs implicit in
the lease are included in rent expense, which affects these margins.
For owned sites, financing costs are reflected in interest expense,
which does not affect these margins. The higher occupancy costs
were partly offset by positive comparable sales in 2000 and 1999.
Also, our purchase of a majority interest in certain affiliate markets
in 2000 and 1999 shifted revenues from franchised and affiliated
restaurants to Company-operated restaurants, reducing the fran-
chised restaurant margin percents in both Asia/Pacific and Latin
America in 2000 and Europe in 1999.
Selling, general & administrative expenses
Consolidated selling, general & administrative expenses increased
7% in 2000 and 1% in 1999. Selling, general & administrative
expenses as a percent of sales were 4.0% in 2000, 3.8% in 1999
and 4.1% in 1998. The increase in 2000 was primarily due to
spending to support the development of Other Brands and the
consolidation of Argentina and Indonesia. Excluding Other Brands
and the consolidations, selling, general & administrative expenses
increased 1% in 2000. Selling, general & administrative expenses in
2000 benefited from weaker foreign currencies and lower expense
for performance-based incentive compensation. The increase in
1999 primarily was due to the consolidation of Sweden and the
addition of Other Brands, partly offset by weaker foreign currencies.
U.S. selling, general & administrative expenses decreased in both
2000 and 1999 due to savings resulting from the home office pro-
ductivity initiative. As a result of the initiative, which benefited both
the U.S. and corporate segments, the Company reached its goal
of saving about $100 million annually beginning in 2000.
Selling, general & administrative expenses
2000 1999 1998
Increase/(decrease) Increase/(decrease)
DOLLARS IN
As Constant As Constant
MILLIONS
Amount reported currency
(1)
Amount reported currency
(1)
Amount
U.S. $ 581 (1)% na $ 584 (2)% na $ 593
Europe 336 (3) 8% 348 6 11% 328
Asia/Pacific 127 9 13 117 9 7 107
Latin America 120 45 45 83 (2) 22 85
Other
(2)
161 94 96 83 20 21 69
Corporate 262 –na 262 (5) na 276
Total $1,587 7% 11% $1,477 1% 4% $1,458
(1) Excludes the effect of foreign currency translation on reported results.
(2) Includes selling, general & administrative expenses for Other Brands of
$85 million in 2000 and $12 million in 1999.
na Not applicable.
Selling, general & administrative expenses have been restated
to break out corporate expenses from the operating segments.
Corporate expenses are composed of home office support costs
in areas such as facilities, finance, human resources, information
technology, legal, supply chain management and training.
Other operating income, net
Other operating income includes gains on sales of restaurant busi-
nesses, equity in earnings of unconsolidated affiliates, net gains or
losses from property dispositions and other transactions related to
franchising and the food service business.
Other operating income, net
IN MILLIONS 2000 1999 1998
Gains on sales of restaurant businesses $87 $75 $61
Equity in earnings of unconsolidated affiliates 121 138 89
Net losses from property dispositions –(71) (71)
Other (12) (18) (19)
Total $196 $124 $ 60
Gains on sales of restaurant businesses include gains from sales
of Company-operated restaurants, as well as gains from exercises
of purchase options by franchisees with business facilities lease
arrangements (arrangements where the Company leases the busi-
nesses, including equipment, to franchisees who have options to
purchase the businesses). The Company’s purchases and sales of
businesses with its franchisees and affiliates are aimed at achieving
an optimal ownership mix in each market. These transactions are
an integral part of our business and resulting gains are recorded in
operating income. Equity in earnings of unconsolidated affiliates—
businesses in which the Company actively participates, but does
not control—is reported after interest expense and income taxes,
except for U.S. restaurant partnerships, which are reported before
income taxes. Net losses from property dispositions result from
disposals of properties due to restaurant closings, relocations and
other transactions.
Equity in earnings from unconsolidated affiliates in 1999 included
a $21 million gain from the sale of real estate in a U.S. partnership.
Year in review 31