Siemens 2008 Annual Report Download - page 152
Download and view the complete annual report
Please find page 152 of the 2008 Siemens annual report below. You can navigate through the pages in the report by either clicking on the pages listed below, or by using the keyword search tool below to find specific information within the annual report.-
 1
1 -
2
-
3
-
4
-
5
-
6
-
7
-
8
-
9
-
10
-
11
-
12
-
13
-
14
-
15
-
16
-
17
-
18
-
19
-
20
-
21
-
22
-
23
-
24
-
25
-
26
-
27
-
28
-
29
-
30
-
31
-
32
-
33
-
34
-
35
-
36
-
37
-
38
-
39
-
40
-
41
-
42
-
43
-
44
-
45
-
46
-
47
-
48
-
49
-
50
-
51
-
52
-
53
-
54
-
55
-
56
-
57
-
58
-
59
-
60
-
61
-
62
-
63
-
64
-
65
-
66
-
67
-
68
-
69
-
70
-
71
-
72
-
73
-
74
-
75
-
76
-
77
-
78
-
79
-
80
-
81
-
82
-
83
-
84
-
85
-
86
-
87
-
88
-
89
-
90
-
91
-
92
-
93
-
94
-
95
-
96
-
97
-
98
-
99
-
100
-
101
-
102
-
103
-
104
-
105
-
106
-
107
-
108
-
109
-
110
-
111
-
112
-
113
-
114
-
115
-
116
-
117
-
118
-
119
-
120
-
121
-
122
-
123
-
124
-
125
-
126
-
127
-
128
-
129
-
130
-
131
-
132
-
133
-
134
-
135
-
136
-
137
-
138
-
139
-
140
-
141
-
 142
142 -
 143
143 -
 144
144 -
 145
145 -
 146
146 -
 147
147 -
 148
148 -
 149
149 -
 150
150 -
 151
151 -
 152
152 -
 153
153 -
 154
154 -
 155
155 -
 156
156 -
 157
157 -
 158
158 -
 159
159 -
 160
160 -
 161
161 -
 162
162 -
163
-
164
-
165
-
166
-
167
-
168
-
169
-
170
-
171
-
172
-
173
-
174
-
175
-
176
-
177
-
178
-
179
-
180
-
181
-
182
-
183
-
184
-
185
-
186
-
187
-
188
-
189
-
190
-
191
-
192
-
193
-
194
-
195
-
196
-
197
-
198
-
199
-
200
-
201
-
202
-
203
-
204
-
205
-
206
-
207
-
208
-
209
-
210
-
211
-
212
-
213
-
214
-
215
-
216
-
217
-
218
-
219
-
220
-
221
-
222
-
223
-
224
-
225
-
226
-
227
-
228
-
229
-
230
-
231
-
232
-
233
-
234
-
235
-
236
-
237
-
238
-
239
-
240
-
241
-
242
-
243
-
244
-
245
-
246
-
247
-
248
-
249
-
250
-
251
-
252
-
253
-
254
-
255
-
256
-
257
-
258
-
259
-
260
-
261
-
262
-
263
-
264
-
265
-
266
-
267
-
268
-
269
-
270
-
271
-
272
-
273
-
274
-
275
-
276
-
277
-
278
-
279
-
280
-
281
-
282
-
283
-
284
-
285
-
286
-
287
-
288
-
289
-
290
-
291
-
292
-
293
-
294
-
295
-
296
-
297
-
298
-
299
-
300
-
301
-
302
-
303
-
304
-
305
-
306
-
307
-
308
-
309
-
310
-
311
-
312
-
313
-
314
-
315
-
316
-
317
-
318
-
319
-
320
-
321
-
322
-
323
-
324
-
325
-
326
-
327
-
328
-
329
-
330
 |
 |

56 Management’s discussion and analysis
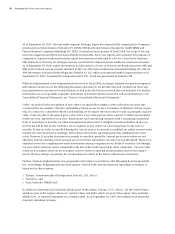
As a consequence of the implementation of the SG&A program, Siemens expects to cut around 12,600 jobs
worldwide. Expenses in the amount of €1.081 billion were accounted for job reduction measures under the
SG&A program and related to the program in scal 2008. Within Segment Information, these expenses are
recognized under Corporate items.
Basis of presentation
In scal 2008, the Company rearranged its organization. As announced in November 2007, Siemens AG reorgan-
ized its operations to create the three Sectors Industry, Energy and Healthcare which in turn comprise 15 Divi-
sions. Siemens’ nancial reporting was adapted to reect the new organizational structure in the second half of
the current scal year. External nancial reporting on the basis of three sectors and for 14 divisions was com-
menced in the third quarter of scal 2008. Financial results relating to the Energy Service Division, which is part
of the Energy Sector, are reected in the Fossil Power Generation Division and the Oil & Gas Division. The three
Sectors, as well as Equity Investments, Siemens IT Solutions and Services and Siemens Financial Services (SFS),
constitute reportable segments in accordance with International Financial Reporting Standards (IFRS).
This new structure consolidates the previous twelve reportable segments referred to as Groups. The following
gure contrasts the previous basis of presentation as of September 30, 2007 and the current basis of presen-
tation as of September 30, 2008, and also indicates some additional adjustments made as part of the reorgani-
zation.
* External and internal consultancy costs; without com-
pliance costs and discontinued operations; including
non-SG&A consultancy costs
** All legal entities including minority investments
without threshold
*** Reporting units belonging to Sectors
Number of reporting units***
Actual 2007
~ 900
Target 2010
~ 500
– 40%
Number of legal entities**
Actual 2007
~ 1,800
Target 2010
< 1,000
– 40%
Consultancy costs* (€ in millions)
Actual 2007
600
Target 2010
< 300
– 50%
IT costs (€ in billions)
– 25%
Actual 2007
1.3
Target 2010
~ 1.0