Siemens 2008 Annual Report Download - page 180
Download and view the complete annual report
Please find page 180 of the 2008 Siemens annual report below. You can navigate through the pages in the report by either clicking on the pages listed below, or by using the keyword search tool below to find specific information within the annual report.-
 1
1 -
2
-
3
-
4
-
5
-
6
-
7
-
8
-
9
-
10
-
11
-
12
-
13
-
14
-
15
-
16
-
17
-
18
-
19
-
20
-
21
-
22
-
23
-
24
-
25
-
26
-
27
-
28
-
29
-
30
-
31
-
32
-
33
-
34
-
35
-
36
-
37
-
38
-
39
-
40
-
41
-
42
-
43
-
44
-
45
-
46
-
47
-
48
-
49
-
50
-
51
-
52
-
53
-
54
-
55
-
56
-
57
-
58
-
59
-
60
-
61
-
62
-
63
-
64
-
65
-
66
-
67
-
68
-
69
-
70
-
71
-
72
-
73
-
74
-
75
-
76
-
77
-
78
-
79
-
80
-
81
-
82
-
83
-
84
-
85
-
86
-
87
-
88
-
89
-
90
-
91
-
92
-
93
-
94
-
95
-
96
-
97
-
98
-
99
-
100
-
101
-
102
-
103
-
104
-
105
-
106
-
107
-
108
-
109
-
110
-
111
-
112
-
113
-
114
-
115
-
116
-
117
-
118
-
119
-
120
-
121
-
122
-
123
-
124
-
125
-
126
-
127
-
128
-
129
-
130
-
131
-
132
-
133
-
134
-
135
-
136
-
137
-
138
-
139
-
140
-
141
-
142
-
143
-
144
-
145
-
146
-
147
-
148
-
149
-
150
-
151
-
152
-
153
-
154
-
155
-
156
-
157
-
158
-
159
-
160
-
161
-
162
-
163
-
164
-
165
-
166
-
167
-
168
-
169
-
 170
170 -
 171
171 -
 172
172 -
 173
173 -
 174
174 -
 175
175 -
 176
176 -
 177
177 -
 178
178 -
 179
179 -
 180
180 -
 181
181 -
 182
182 -
 183
183 -
 184
184 -
 185
185 -
 186
186 -
 187
187 -
 188
188 -
 189
189 -
 190
190 -
191
-
192
-
193
-
194
-
195
-
196
-
197
-
198
-
199
-
200
-
201
-
202
-
203
-
204
-
205
-
206
-
207
-
208
-
209
-
210
-
211
-
212
-
213
-
214
-
215
-
216
-
217
-
218
-
219
-
220
-
221
-
222
-
223
-
224
-
225
-
226
-
227
-
228
-
229
-
230
-
231
-
232
-
233
-
234
-
235
-
236
-
237
-
238
-
239
-
240
-
241
-
242
-
243
-
244
-
245
-
246
-
247
-
248
-
249
-
250
-
251
-
252
-
253
-
254
-
255
-
256
-
257
-
258
-
259
-
260
-
261
-
262
-
263
-
264
-
265
-
266
-
267
-
268
-
269
-
270
-
271
-
272
-
273
-
274
-
275
-
276
-
277
-
278
-
279
-
280
-
281
-
282
-
283
-
284
-
285
-
286
-
287
-
288
-
289
-
290
-
291
-
292
-
293
-
294
-
295
-
296
-
297
-
298
-
299
-
300
-
301
-
302
-
303
-
304
-
305
-
306
-
307
-
308
-
309
-
310
-
311
-
312
-
313
-
314
-
315
-
316
-
317
-
318
-
319
-
320
-
321
-
322
-
323
-
324
-
325
-
326
-
327
-
328
-
329
-
330
 |
 |

84 Management’s discussion and analysis
Operating activities provided net cash of €8.624 billion in scal 2008, compared to net cash provided of €7.328
billion in scal 2007. These results include both continuing and discontinued operations. Within the total, con-
tinuing operations provided net cash of €9.281 billion compared to €9.822 billion in the same period a year ear-
lier. While income from continuing operations in scal 2008 was substantially lower than in scal 2007, the
major factors in the decrease will be cash effective in future periods. These factors include the approximately
€1 billion provision related to ongoing settlement negotiations with authorities in Germany and the U.S., the
approximately €1.1 billion severance charges related to our SG&A reduction program, and restructuring
expense in particular at Healthcare and Industry. The current period includes a higher build-up in inventories,
especially for the Industry Sector, largely offset by higher billings in excess related to large projects in Industry
and Energy. Partly due to these billings in excess and the matters described above, liabilities and provisions
increased substantially year-over-year. The prior-year period beneted from a substantial decrease in receiv-
ables of approximately €2.2 billion related to the SV carve-out and the transfer of carrier activities into NSN, only
partly offset by a €431 million penalty payment related to a European Union antitrust investigation. Discontin-
ued operations improved to net cash used of €657 million in scal 2008, including a €201 million payment for
a previously disclosed ne imposed by the Munich district court, related to former Com activities. For compari-
son, net cash used of €2.494 billion in scal 2007 included a substantially higher build up of net working capital,
particularly receivables, as mentioned above.
Investing activities in continuing and discontinued operations used net cash of €407 million in scal 2008,
compared to net cash used of €11.357 billion in scal 2007. Within the total, net cash used in investing activities
for continuing operations amounted to €9.989 billion in the current year and to €10.068 billion in the prior-year.
Cash outows in the current period primarily related to the acquisition of Dade Behring at Healthcare for
€4.4 billion (net of €69 million cash acquired) and to asset purchases in secondary markets, primarily related to
the growth of SFS’s commercial nance business, resulting in a cash outow of approximately €1.5 billion. Cash
outows in the prior-year period included €4.2 billion related to the acquisition of Bayer’s diagnostic business
at Healthcare, €2.7 billion for the UGS acquisition at Industry as well as a payment to acquire AG Kühnle, Kopp &
Kausch at Energy. Discontinued operations provided €9.582 billion in net cash during the current period, due
primarily to proceeds of €11.4 billion from the sale of SV and net cash used of approximately €1.1 billion relat-
ing to the transfer of SEN activities into EN, compared to net cash used of €1.289 billion in the prior year.
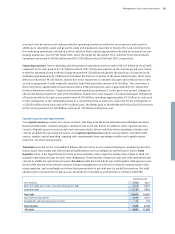
Free cash ow from continuing and discontinued operations for Siemens amounted to €4.903 billion in scal
2008, compared to €3.577 billion in scal 2007. Within the total, Free cash ow for continuing operations in the
current period amounted to €5.739 billion compared to €6.755 billion a year earlier. The change year-over-year
Continuing
operations
Discontinued
operations
Continuing and
discontinued
operations
Year ended September 30,
(€ in millions) 2008 2007 2008 2007 2008 2007
Net cash provided by (used in):
Operating activities A 9,281 9,822 (657) (2,494) 8,624 7,328
Investing activities (9,989) (10,068) 9,582 (1,289) (407) (11,357)
Herein: Additions to intangible assets
and property, plant and equipment B (3,542) (3,067) (179) (684) (3,721) (3,751)
Free cash ow* A+B 5,739 6,755 (836) (3,178) 4,903 3,577
* The closest comparable nancial measure under IFRS is “Net cash provided by (used in) operating activities.” “Net cash provided by
(used in) operating activities” from continuing operations as well as from continuing and discontinued operations is reported within
the “Consolidated Statements of Cash Flow” for Siemens. “Additions to intangible assets and property, plant and equipment” from con-
tinuing operations is reconciled to the gures as reported in the “Consolidated Statements of Cash Flow” in the “Notes to Consolidated
Financial Statements.” Other companies that report Free cash ow may dene and calculate it differently.