Siemens 2008 Annual Report Download - page 181
Download and view the complete annual report
Please find page 181 of the 2008 Siemens annual report below. You can navigate through the pages in the report by either clicking on the pages listed below, or by using the keyword search tool below to find specific information within the annual report.-
 1
1 -
2
-
3
-
4
-
5
-
6
-
7
-
8
-
9
-
10
-
11
-
12
-
13
-
14
-
15
-
16
-
17
-
18
-
19
-
20
-
21
-
22
-
23
-
24
-
25
-
26
-
27
-
28
-
29
-
30
-
31
-
32
-
33
-
34
-
35
-
36
-
37
-
38
-
39
-
40
-
41
-
42
-
43
-
44
-
45
-
46
-
47
-
48
-
49
-
50
-
51
-
52
-
53
-
54
-
55
-
56
-
57
-
58
-
59
-
60
-
61
-
62
-
63
-
64
-
65
-
66
-
67
-
68
-
69
-
70
-
71
-
72
-
73
-
74
-
75
-
76
-
77
-
78
-
79
-
80
-
81
-
82
-
83
-
84
-
85
-
86
-
87
-
88
-
89
-
90
-
91
-
92
-
93
-
94
-
95
-
96
-
97
-
98
-
99
-
100
-
101
-
102
-
103
-
104
-
105
-
106
-
107
-
108
-
109
-
110
-
111
-
112
-
113
-
114
-
115
-
116
-
117
-
118
-
119
-
120
-
121
-
122
-
123
-
124
-
125
-
126
-
127
-
128
-
129
-
130
-
131
-
132
-
133
-
134
-
135
-
136
-
137
-
138
-
139
-
140
-
141
-
142
-
143
-
144
-
145
-
146
-
147
-
148
-
149
-
150
-
151
-
152
-
153
-
154
-
155
-
156
-
157
-
158
-
159
-
160
-
161
-
162
-
163
-
164
-
165
-
166
-
167
-
168
-
169
-
170
-
 171
171 -
 172
172 -
 173
173 -
 174
174 -
 175
175 -
 176
176 -
 177
177 -
 178
178 -
 179
179 -
 180
180 -
 181
181 -
 182
182 -
 183
183 -
 184
184 -
 185
185 -
 186
186 -
 187
187 -
 188
188 -
 189
189 -
 190
190 -
 191
191 -
192
-
193
-
194
-
195
-
196
-
197
-
198
-
199
-
200
-
201
-
202
-
203
-
204
-
205
-
206
-
207
-
208
-
209
-
210
-
211
-
212
-
213
-
214
-
215
-
216
-
217
-
218
-
219
-
220
-
221
-
222
-
223
-
224
-
225
-
226
-
227
-
228
-
229
-
230
-
231
-
232
-
233
-
234
-
235
-
236
-
237
-
238
-
239
-
240
-
241
-
242
-
243
-
244
-
245
-
246
-
247
-
248
-
249
-
250
-
251
-
252
-
253
-
254
-
255
-
256
-
257
-
258
-
259
-
260
-
261
-
262
-
263
-
264
-
265
-
266
-
267
-
268
-
269
-
270
-
271
-
272
-
273
-
274
-
275
-
276
-
277
-
278
-
279
-
280
-
281
-
282
-
283
-
284
-
285
-
286
-
287
-
288
-
289
-
290
-
291
-
292
-
293
-
294
-
295
-
296
-
297
-
298
-
299
-
300
-
301
-
302
-
303
-
304
-
305
-
306
-
307
-
308
-
309
-
310
-
311
-
312
-
313
-
314
-
315
-
316
-
317
-
318
-
319
-
320
-
321
-
322
-
323
-
324
-
325
-
326
-
327
-
328
-
329
-
330
 |
 |

Management’s discussion and analysis 85
was due to the decrease in net cash provided by operating actvities as well as by an increase in cash used for
additions to intangible assets and property, plant and equipment especially at Energy. The cash conversion rate
for continuing operations, calculated as Free cash ow from continuing operations divided by income from con-
tinuing operations, was 3.09 for scal 2008, above the target for the period. Free cash ow from discontinued
operations amounted to €(836) million and €(3.178) billion in scal 2008 and 2007, respectively.
Financing activities from continuing and discontinued operations used net cash of €6.129 billion in scal 2008
compared to net cash used of €1.187 billion in scal 2007. Financing activities in the current period were charac-
terized by substantial cash outows of approximately €4.350 billion relating to the purchase of common stock,
including approximately €4.0 billion in total under the rst two tranches of the share buyback plan. Short-term
debt was reduced by €4.635 billion, mainly due to the repayment of commercial paper and medium-term notes
as well as repayment of debt originally raised by Dade Behring in the amount of €0.4 billion. The execution of
three long term capital market transactions in scal 2008 provided net cash of approximately €5.7 billion (for
further information refer to “Capital resources and capital requirements”). In the prior-year period, changes in
short-term debt provided net cash of €4.386 billion, mainly due to the issuance of commercial paper. Repayment
of long-term debt in the prior-year period used €4.595 billion, including approximately €3.2 billion in cash used
for the redemption of the outstanding notes of a convertible bond as well as by cash used for the redemption of
a CHF250 million bond issue and a €991 million bond. Dividends paid to shareholders (for scal 2007) increased
in the current period to €1.462 billion, up from €1.292 billion in the prior year.
Capital resources and requirements
Our capital resources consist of a variety of short- and long-term nancial instruments including loans from
nancial institutions, commercial paper, medium-term notes and bonds. In addition, other capital resources
consist of liquid resources such as cash and cash equivalents, future cash ows from operating activities and
current available-for-sale nancial assets. Our capital requirements include, among others, scheduled debt
service, regular capital spending, ongoing cash requirements from operating activities and capital require-
ments for our share buyback plan.
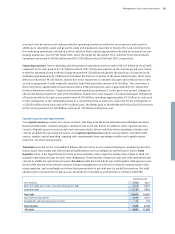
Total debt as stated on the Consolidated Balance Sheets relates to our commercial papers, medium-term notes,
bonds, loans from banks and other nancial indebtedness such as obligations under nance leases. Total
liquidity refers to the liquid nancial assets we had available at the respective balance sheet dates to fund our
business operations and pay for near term obligations. Total liquidity comprises Cash and cash equivalents and
current Available-for-sale nancial assets. Net debt results from total debt less total liquidity. Management uses
the net debt measure for internal corporate nance management, as well as for external communication with
rating agencies, and accordingly we believe that presentation of net debt may be useful for investors. Net debt
should not be considered in isolation as an alternative to total debt as presented in accordance with IFRS.
September 30,
(€ in millions) 2008 2007
Short-term debt and current maturities of long-term debt 1,819 5,637
Long-term debt 14,260 9,860
Total debt 16,079 15,497
Cash and cash equivalents 6,893 4,005
Available-for-sale nancial assets (current) 152 193
Total liquidity 7,045 4,198
Net debt 9,034 11,299