Siemens 2008 Annual Report Download - page 173
Download and view the complete annual report
Please find page 173 of the 2008 Siemens annual report below. You can navigate through the pages in the report by either clicking on the pages listed below, or by using the keyword search tool below to find specific information within the annual report.-
 1
1 -
2
-
3
-
4
-
5
-
6
-
7
-
8
-
9
-
10
-
11
-
12
-
13
-
14
-
15
-
16
-
17
-
18
-
19
-
20
-
21
-
22
-
23
-
24
-
25
-
26
-
27
-
28
-
29
-
30
-
31
-
32
-
33
-
34
-
35
-
36
-
37
-
38
-
39
-
40
-
41
-
42
-
43
-
44
-
45
-
46
-
47
-
48
-
49
-
50
-
51
-
52
-
53
-
54
-
55
-
56
-
57
-
58
-
59
-
60
-
61
-
62
-
63
-
64
-
65
-
66
-
67
-
68
-
69
-
70
-
71
-
72
-
73
-
74
-
75
-
76
-
77
-
78
-
79
-
80
-
81
-
82
-
83
-
84
-
85
-
86
-
87
-
88
-
89
-
90
-
91
-
92
-
93
-
94
-
95
-
96
-
97
-
98
-
99
-
100
-
101
-
102
-
103
-
104
-
105
-
106
-
107
-
108
-
109
-
110
-
111
-
112
-
113
-
114
-
115
-
116
-
117
-
118
-
119
-
120
-
121
-
122
-
123
-
124
-
125
-
126
-
127
-
128
-
129
-
130
-
131
-
132
-
133
-
134
-
135
-
136
-
137
-
138
-
139
-
140
-
141
-
142
-
143
-
144
-
145
-
146
-
147
-
148
-
149
-
150
-
151
-
152
-
153
-
154
-
155
-
156
-
157
-
158
-
159
-
160
-
161
-
162
-
 163
163 -
 164
164 -
 165
165 -
 166
166 -
 167
167 -
 168
168 -
 169
169 -
 170
170 -
 171
171 -
 172
172 -
 173
173 -
 174
174 -
 175
175 -
 176
176 -
 177
177 -
 178
178 -
 179
179 -
 180
180 -
 181
181 -
 182
182 -
 183
183 -
184
-
185
-
186
-
187
-
188
-
189
-
190
-
191
-
192
-
193
-
194
-
195
-
196
-
197
-
198
-
199
-
200
-
201
-
202
-
203
-
204
-
205
-
206
-
207
-
208
-
209
-
210
-
211
-
212
-
213
-
214
-
215
-
216
-
217
-
218
-
219
-
220
-
221
-
222
-
223
-
224
-
225
-
226
-
227
-
228
-
229
-
230
-
231
-
232
-
233
-
234
-
235
-
236
-
237
-
238
-
239
-
240
-
241
-
242
-
243
-
244
-
245
-
246
-
247
-
248
-
249
-
250
-
251
-
252
-
253
-
254
-
255
-
256
-
257
-
258
-
259
-
260
-
261
-
262
-
263
-
264
-
265
-
266
-
267
-
268
-
269
-
270
-
271
-
272
-
273
-
274
-
275
-
276
-
277
-
278
-
279
-
280
-
281
-
282
-
283
-
284
-
285
-
286
-
287
-
288
-
289
-
290
-
291
-
292
-
293
-
294
-
295
-
296
-
297
-
298
-
299
-
300
-
301
-
302
-
303
-
304
-
305
-
306
-
307
-
308
-
309
-
310
-
311
-
312
-
313
-
314
-
315
-
316
-
317
-
318
-
319
-
320
-
321
-
322
-
323
-
324
-
325
-
326
-
327
-
328
-
329
-
330
 |
 |

Management’s discussion and analysis 77
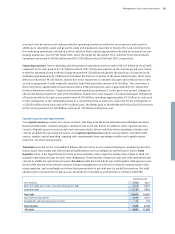
Our primary measure for the conversion of revenue growth to income growth is prot margin, applied and
reported at the Sector, Division and Cross-Sector Business level. For our Sectors, Divisions and for Siemens IT
Solutions and Services, prot margin is calculated as the ratio of prot and revenue, while prot for these busi-
nesses is dened as earnings before nancing interest, certain pension costs, and income taxes, and also may
exclude various categories of items, which are not allocated to these businesses since Management does not
regard such items as indicative of their performance.
In contrast, and in line with common practice in the nancial services industry, the protability measure for SFS
is return on equity, dened as Income before income taxes divided by the average allocated equity for SFS. Our
2010 target ranges and the scal 2008 performances of our Sectors, Divisions and Cross-Sector Businesses, are
shown below.
Profit Margin
Formula:
Prot
= × 100%
Revenue
* Return on Equity
9 – 13%
12 – 17%
11 – 16%
7 – 10%
10 – 12%
5 – 7%
5 – 7%
11 – 15%
11 – 15%
12 – 16%
10 – 14%
10 – 14%
11 – 15%
14 – 17%
14 – 17%
11 – 14%
16 – 19%
5 – 7%
20 – 23%
10.1%
18.5%
13.5%
7.8%
8.7%
6.2%
– 3.9%
6.4%
– 1.1%
11.6%
8.7%
10.3%
11.5%
11.0%
13.2%
4.4%
7.8%
2.7%
31.4%
Industry
Industry Automation
Drive Technologies
Building Technologies
OSRAM
Industry Solutions
Mobility
Energy
Fossil Power Generation
Renewable Energy
Oil & Gas
Power Transmission
Power Distribution
Healthcare
Imaging & IT
Workow & Solutions
Diagnostics
Siemens IT Solutions and Services
Siemens Financial Services*
Margin
Margin ranges
Fiscal year 2008
Target range