Siemens 2008 Annual Report Download - page 188
Download and view the complete annual report
Please find page 188 of the 2008 Siemens annual report below. You can navigate through the pages in the report by either clicking on the pages listed below, or by using the keyword search tool below to find specific information within the annual report.-
 1
1 -
2
-
3
-
4
-
5
-
6
-
7
-
8
-
9
-
10
-
11
-
12
-
13
-
14
-
15
-
16
-
17
-
18
-
19
-
20
-
21
-
22
-
23
-
24
-
25
-
26
-
27
-
28
-
29
-
30
-
31
-
32
-
33
-
34
-
35
-
36
-
37
-
38
-
39
-
40
-
41
-
42
-
43
-
44
-
45
-
46
-
47
-
48
-
49
-
50
-
51
-
52
-
53
-
54
-
55
-
56
-
57
-
58
-
59
-
60
-
61
-
62
-
63
-
64
-
65
-
66
-
67
-
68
-
69
-
70
-
71
-
72
-
73
-
74
-
75
-
76
-
77
-
78
-
79
-
80
-
81
-
82
-
83
-
84
-
85
-
86
-
87
-
88
-
89
-
90
-
91
-
92
-
93
-
94
-
95
-
96
-
97
-
98
-
99
-
100
-
101
-
102
-
103
-
104
-
105
-
106
-
107
-
108
-
109
-
110
-
111
-
112
-
113
-
114
-
115
-
116
-
117
-
118
-
119
-
120
-
121
-
122
-
123
-
124
-
125
-
126
-
127
-
128
-
129
-
130
-
131
-
132
-
133
-
134
-
135
-
136
-
137
-
138
-
139
-
140
-
141
-
142
-
143
-
144
-
145
-
146
-
147
-
148
-
149
-
150
-
151
-
152
-
153
-
154
-
155
-
156
-
157
-
158
-
159
-
160
-
161
-
162
-
163
-
164
-
165
-
166
-
167
-
168
-
169
-
170
-
171
-
172
-
173
-
174
-
175
-
176
-
177
-
 178
178 -
 179
179 -
 180
180 -
 181
181 -
 182
182 -
 183
183 -
 184
184 -
 185
185 -
 186
186 -
 187
187 -
 188
188 -
 189
189 -
 190
190 -
 191
191 -
 192
192 -
 193
193 -
 194
194 -
 195
195 -
 196
196 -
 197
197 -
 198
198 -
199
-
200
-
201
-
202
-
203
-
204
-
205
-
206
-
207
-
208
-
209
-
210
-
211
-
212
-
213
-
214
-
215
-
216
-
217
-
218
-
219
-
220
-
221
-
222
-
223
-
224
-
225
-
226
-
227
-
228
-
229
-
230
-
231
-
232
-
233
-
234
-
235
-
236
-
237
-
238
-
239
-
240
-
241
-
242
-
243
-
244
-
245
-
246
-
247
-
248
-
249
-
250
-
251
-
252
-
253
-
254
-
255
-
256
-
257
-
258
-
259
-
260
-
261
-
262
-
263
-
264
-
265
-
266
-
267
-
268
-
269
-
270
-
271
-
272
-
273
-
274
-
275
-
276
-
277
-
278
-
279
-
280
-
281
-
282
-
283
-
284
-
285
-
286
-
287
-
288
-
289
-
290
-
291
-
292
-
293
-
294
-
295
-
296
-
297
-
298
-
299
-
300
-
301
-
302
-
303
-
304
-
305
-
306
-
307
-
308
-
309
-
310
-
311
-
312
-
313
-
314
-
315
-
316
-
317
-
318
-
319
-
320
-
321
-
322
-
323
-
324
-
325
-
326
-
327
-
328
-
329
-
330
 |
 |

92 Management’s discussion and analysis
In scal 2008, the net increase in goodwill and other intangible assets primarily related to the acquisition of
Dade Behring, based on the preliminary purchase price allocation. For further information see “Notes to Consol-
idated Financial Statements.”
The increase in other nancial assets results mainly from SFS’ growth in the commercial nance business
including asset purchases in secondary markets. For further information see “Segment information analysis.”
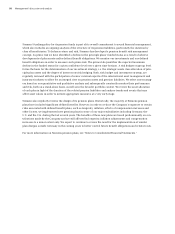
The table below shows current and long-term liabilities at the respective balance sheet dates:
Short-term debt and current maturities of long-term debt totaled €1.819 billion at the end of scal 2008,
a decrease of €3.818 billion from the prior year-end. This decrease mainly results from a lower level of outstand-
ing commercial paper, totaling €198 million as of September 30, 2008 compared to €4.332 billion a year earlier.
The increase in current provisions is due mainly to the provision in the amount of approximately €1 billion in
connection with the ongoing settlement negotiations mentioned earlier.
Other current liabilities increased by €4.586 billion compared to scal 2007. The increase was primarily driven
by increased billings in excess of cost, particularly in the Energy Sector. Other current liabilities as of September
30, 2008 also include accruals for future severance payments we expect to make under our SG&A program.
The decrease in liabilities associated with assets classied as held for disposal was driven primarily by the
divestments of SV and SEN mentioned above.
Compared to scal 2007, long-term debt increased by €4.400 billion to €14.260 billion at the end of scal 2008,
primarily due to several capital market transactions. During the current period, we updated our medium-term
notes program and issued additional xed-rate notes in the total amount of €4.150 billion. In addition, we issued
assignable loans (“Schuldscheindarlehen”) totaling €1.1 billion in scal 2008.
September 30,
(€ in millions) 2008 2007
Short-term debt and current maturities of long-term debt 1,819 5,637
Trade payables 8,860 8,382
Other current nancial liabilities 2,427 2,553
Current provisions 5,165 3,581
Income tax payables 1,970 2,141
Other current liabilities 21,644 17,058
Liabilities associated with assets classied as held for disposal 566 4,542
Total current liabilities 42,451 43,894
Long-term debt 14,260 9,860
Pension plans and similar commitments 4,361 2,780
Deferred tax liabilities 726 580
Provisions 2,533 2,103
Other nancial liabilities 376 411
Other liabilities 2,376 2,300
Total long-term liabilities 24,632 18,034