Siemens 2008 Annual Report Download - page 177
Download and view the complete annual report
Please find page 177 of the 2008 Siemens annual report below. You can navigate through the pages in the report by either clicking on the pages listed below, or by using the keyword search tool below to find specific information within the annual report.-
 1
1 -
2
-
3
-
4
-
5
-
6
-
7
-
8
-
9
-
10
-
11
-
12
-
13
-
14
-
15
-
16
-
17
-
18
-
19
-
20
-
21
-
22
-
23
-
24
-
25
-
26
-
27
-
28
-
29
-
30
-
31
-
32
-
33
-
34
-
35
-
36
-
37
-
38
-
39
-
40
-
41
-
42
-
43
-
44
-
45
-
46
-
47
-
48
-
49
-
50
-
51
-
52
-
53
-
54
-
55
-
56
-
57
-
58
-
59
-
60
-
61
-
62
-
63
-
64
-
65
-
66
-
67
-
68
-
69
-
70
-
71
-
72
-
73
-
74
-
75
-
76
-
77
-
78
-
79
-
80
-
81
-
82
-
83
-
84
-
85
-
86
-
87
-
88
-
89
-
90
-
91
-
92
-
93
-
94
-
95
-
96
-
97
-
98
-
99
-
100
-
101
-
102
-
103
-
104
-
105
-
106
-
107
-
108
-
109
-
110
-
111
-
112
-
113
-
114
-
115
-
116
-
117
-
118
-
119
-
120
-
121
-
122
-
123
-
124
-
125
-
126
-
127
-
128
-
129
-
130
-
131
-
132
-
133
-
134
-
135
-
136
-
137
-
138
-
139
-
140
-
141
-
142
-
143
-
144
-
145
-
146
-
147
-
148
-
149
-
150
-
151
-
152
-
153
-
154
-
155
-
156
-
157
-
158
-
159
-
160
-
161
-
162
-
163
-
164
-
165
-
166
-
 167
167 -
 168
168 -
 169
169 -
 170
170 -
 171
171 -
 172
172 -
 173
173 -
 174
174 -
 175
175 -
 176
176 -
 177
177 -
 178
178 -
 179
179 -
 180
180 -
 181
181 -
 182
182 -
 183
183 -
 184
184 -
 185
185 -
 186
186 -
 187
187 -
188
-
189
-
190
-
191
-
192
-
193
-
194
-
195
-
196
-
197
-
198
-
199
-
200
-
201
-
202
-
203
-
204
-
205
-
206
-
207
-
208
-
209
-
210
-
211
-
212
-
213
-
214
-
215
-
216
-
217
-
218
-
219
-
220
-
221
-
222
-
223
-
224
-
225
-
226
-
227
-
228
-
229
-
230
-
231
-
232
-
233
-
234
-
235
-
236
-
237
-
238
-
239
-
240
-
241
-
242
-
243
-
244
-
245
-
246
-
247
-
248
-
249
-
250
-
251
-
252
-
253
-
254
-
255
-
256
-
257
-
258
-
259
-
260
-
261
-
262
-
263
-
264
-
265
-
266
-
267
-
268
-
269
-
270
-
271
-
272
-
273
-
274
-
275
-
276
-
277
-
278
-
279
-
280
-
281
-
282
-
283
-
284
-
285
-
286
-
287
-
288
-
289
-
290
-
291
-
292
-
293
-
294
-
295
-
296
-
297
-
298
-
299
-
300
-
301
-
302
-
303
-
304
-
305
-
306
-
307
-
308
-
309
-
310
-
311
-
312
-
313
-
314
-
315
-
316
-
317
-
318
-
319
-
320
-
321
-
322
-
323
-
324
-
325
-
326
-
327
-
328
-
329
-
330
 |
 |

Management’s discussion and analysis 81
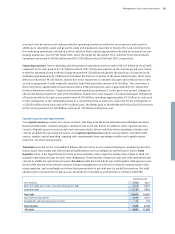
Capital structure
As of September 30, 2008 and 2007, our capital structure was as follows:
In scal 2008, total equity attributable to shareholders of Siemens AG decreased by 8% compared to scal 2007,
in part due to 52,645,665 shares in treasury with a carrying amount of €4.002 billion as of September 30, 2008.
These treasury shares were purchased predominantly under the share buyback plan announced in November
2007, as discussed below. Total debt increased 4% during the last scal year as a result of issuance of new long-
term debt, partly balanced by the repayment of short-term debt. This resulted in a decrease in equity as a per-
centage of total capital to 62% compared to 65% in scal 2007. Debt as a percentage of total capital increased to
38% from 35% in the prior year. For further information related to the share buyback plan and the issuance and
repayment of debt, see “Notes to Consolidated Financial Statements.”
Siemens is not subject to any statutory capital requirements. Commitments exist to sell or otherwise issue com-
mon shares in connection with established share-based compensation plans. In scal 2008, commitments for
share-based compensation were fullled through repurchases of the Company's shares. In scal 2009, we also
plan to fulll commitments for share-based compensation through repurchases of the Company’s shares. For
additional information with respect to share-based compensation and treasury shares, see “Notes to Consoli-
dated Financial Statements.”
As part of our Fit42010 program, we decided to improve our capital structure. A key consideration is to maintain
ready access to capital markets through various debt products and to preserve our ability to repay and service
our debt obligations over time. We therefore set a capital structure goal dened as Adjusted industrial net debt
divided by Earnings before interest taxes, depreciation and amortization (EBITDA) as adjusted. The calculation
of Adjusted industrial net debt is set forth in the table below. Adjusted EBITDA is calculated as earnings before
income taxes (EBIT) (adjusted) before amortization (dened as amortization and impairments of intangible
assets other than goodwill) and depreciation and impairments of property, plant and equipment and goodwill.
Adjusted EBIT is income from continuing operations before income taxes less nancial income (expense), net
and income (loss) from investments accounted for using the equity method, net.
The target range for our capital structure ratio is 0.8-1.0, to be achieved by 2010. As a step toward achieving
this target range, we began implementing our previously announced share buyback plan for up to €10 billion
in share repurchases through 2010. In the current scal year and starting on January 28, 2008, we acquired a
total of 52,771,205 Siemens shares with a market value at purchase of approximately €4.0 billion in two tranches
under this plan for the purpose of cancellation and reduction of capital stock, and to a lesser extent, to full
obligations arising out of share-based compensation programs.
September 30,
% Change(€ in millions) 2008 2007
Total equity attributable to shareholders of Siemens AG 26,774 28,996 (8)%
As percentage of total capital 62% 65%
Short-term debt 1,819 5,637
Long-term debt 14,260 9,860
Total debt 16,079 15,497 4%
As percentage of total capital 38% 35%
Total capital (total debt and total equity) 42,853 44,493 (4)%