Siemens 2008 Annual Report Download - page 217
Download and view the complete annual report
Please find page 217 of the 2008 Siemens annual report below. You can navigate through the pages in the report by either clicking on the pages listed below, or by using the keyword search tool below to find specific information within the annual report.-
 1
1 -
2
-
3
-
4
-
5
-
6
-
7
-
8
-
9
-
10
-
11
-
12
-
13
-
14
-
15
-
16
-
17
-
18
-
19
-
20
-
21
-
22
-
23
-
24
-
25
-
26
-
27
-
28
-
29
-
30
-
31
-
32
-
33
-
34
-
35
-
36
-
37
-
38
-
39
-
40
-
41
-
42
-
43
-
44
-
45
-
46
-
47
-
48
-
49
-
50
-
51
-
52
-
53
-
54
-
55
-
56
-
57
-
58
-
59
-
60
-
61
-
62
-
63
-
64
-
65
-
66
-
67
-
68
-
69
-
70
-
71
-
72
-
73
-
74
-
75
-
76
-
77
-
78
-
79
-
80
-
81
-
82
-
83
-
84
-
85
-
86
-
87
-
88
-
89
-
90
-
91
-
92
-
93
-
94
-
95
-
96
-
97
-
98
-
99
-
100
-
101
-
102
-
103
-
104
-
105
-
106
-
107
-
108
-
109
-
110
-
111
-
112
-
113
-
114
-
115
-
116
-
117
-
118
-
119
-
120
-
121
-
122
-
123
-
124
-
125
-
126
-
127
-
128
-
129
-
130
-
131
-
132
-
133
-
134
-
135
-
136
-
137
-
138
-
139
-
140
-
141
-
142
-
143
-
144
-
145
-
146
-
147
-
148
-
149
-
150
-
151
-
152
-
153
-
154
-
155
-
156
-
157
-
158
-
159
-
160
-
161
-
162
-
163
-
164
-
165
-
166
-
167
-
168
-
169
-
170
-
171
-
172
-
173
-
174
-
175
-
176
-
177
-
178
-
179
-
180
-
181
-
182
-
183
-
184
-
185
-
186
-
187
-
188
-
189
-
190
-
191
-
192
-
193
-
194
-
195
-
196
-
197
-
198
-
199
-
200
-
201
-
202
-
203
-
204
-
205
-
206
-
 207
207 -
 208
208 -
 209
209 -
 210
210 -
 211
211 -
 212
212 -
 213
213 -
 214
214 -
 215
215 -
 216
216 -
 217
217 -
 218
218 -
 219
219 -
 220
220 -
 221
221 -
 222
222 -
 223
223 -
 224
224 -
 225
225 -
 226
226 -
 227
227 -
228
-
229
-
230
-
231
-
232
-
233
-
234
-
235
-
236
-
237
-
238
-
239
-
240
-
241
-
242
-
243
-
244
-
245
-
246
-
247
-
248
-
249
-
250
-
251
-
252
-
253
-
254
-
255
-
256
-
257
-
258
-
259
-
260
-
261
-
262
-
263
-
264
-
265
-
266
-
267
-
268
-
269
-
270
-
271
-
272
-
273
-
274
-
275
-
276
-
277
-
278
-
279
-
280
-
281
-
282
-
283
-
284
-
285
-
286
-
287
-
288
-
289
-
290
-
291
-
292
-
293
-
294
-
295
-
296
-
297
-
298
-
299
-
300
-
301
-
302
-
303
-
304
-
305
-
306
-
307
-
308
-
309
-
310
-
311
-
312
-
313
-
314
-
315
-
316
-
317
-
318
-
319
-
320
-
321
-
322
-
323
-
324
-
325
-
326
-
327
-
328
-
329
-
330
 |
 |
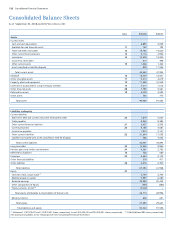
Consolidated Financial Statements 121
2008 2007
Cash ows from operating activities
Net income 5,886 4,038
Adjustments to reconcile net income to cash provided
Amortization, depreciation and impairments 3,213 3,751
Income taxes 831 2,193
Interest (income) expense, net (75) 193
(Gains) on sales and disposals of businesses, intangibles and property, plant and equipment, net (5,092) (2,051)
(Gains) on sales of investments, net(1) (35) (95)
(Gains) losses on sales and impairments of current available-for-sale nancial assets, net (5) 32
(Income) from investments(1) (328) (223)
Other non-cash (income) expenses 383 106
Change in current assets and liabilities
(Increase) decrease in inventories (1,631) (986)
(Increase) decrease in trade and other receivables (1,088) (1,183)
(Increase) decrease in other current assets 167 (486)
Increase (decrease) in trade payables 719 1,158
Increase (decrease) in current provisions 1,414 (258)
Increase (decrease) in other current liabilities 4,417 2,858
Change in other assets and liabilities 200 (883)
Income taxes paid (1,564) (1,930)
Dividends received 337 337
Interest received 875 757
Net cash provided by (used in) operating activities – continuing and discontinued operations 8,624 7,328
Net cash provided by (used in) operating activities – continuing operations 9,281 9,822
Cash ows from investing activities
Additions to intangible assets and property, plant and equipment (3,721) (3,751)
Acquisitions (5,407) (7,370)
Purchases of investments(1) (151) (261)
Purchases of current available-for-sale nancial assets (16) (148)
(Increase) decrease in receivables from nancing activities (2,445) (907)
Proceeds from sales of investments, intangibles and property, plant and equipment(1) 803 1,041
Proceeds from disposals of businesses 10,481 (380)
Proceeds from sales of current available-for-sale nancial assets 49 419
Net cash provided by (used in) investing activities – continuing and discontinued operations (407) (11,357)
Net cash provided by (used in) investing activities – continuing operations (9,989) (10,068)
Cash ows from nancing activities
Proceeds from issuance of common stock – 903
Purchase of common stock (4,350) (101)
Proceeds from re-issuance of treasury stock 248 66
Proceeds from issuance of long-term debt 5,728 766
Repayment of long-term debt (including current maturities of long-term debt) (691) (4,595)
Change in short-term debt (4,635) 4,386
Interest paid (829) (1,169)
Dividends paid (1,462) (1,292)
Dividends paid to minority shareholders (138) (151)
Net cash provided by (used in) nancing activities – continuing and discontinued operations (6,129) (1,187)
Net cash provided by (used in) financing activities – continuing operations 3,730 (5,792)
Effect of exchange rates on cash and cash equivalents (99) (58)
Net increase (decrease) in cash and cash equivalents 1,989 (5,274)
Cash and cash equivalents at beginning of period 4,940 10,214
Cash and cash equivalents at end of period 6,929 4,940
Less: Cash and cash equivalents of assets classied as held for disposal
and discontinued operations at end of period 36 935
Cash and cash equivalents at end of period (Consolidated balance sheets) 6,893 4,005
Consolidated Statements of Cash Flow
For the scal years ended September 30, 2008 and 2007 (in millions of €)
(1) Investments include equity instruments either classied as non-current available-for-sale nancial assets or accounted for using the equity method.
The accompanying Notes are an integral part of these Consolidated Financial Statements.