Siemens 2008 Annual Report Download - page 261
Download and view the complete annual report
Please find page 261 of the 2008 Siemens annual report below. You can navigate through the pages in the report by either clicking on the pages listed below, or by using the keyword search tool below to find specific information within the annual report.-
 1
1 -
2
-
3
-
4
-
5
-
6
-
7
-
8
-
9
-
10
-
11
-
12
-
13
-
14
-
15
-
16
-
17
-
18
-
19
-
20
-
21
-
22
-
23
-
24
-
25
-
26
-
27
-
28
-
29
-
30
-
31
-
32
-
33
-
34
-
35
-
36
-
37
-
38
-
39
-
40
-
41
-
42
-
43
-
44
-
45
-
46
-
47
-
48
-
49
-
50
-
51
-
52
-
53
-
54
-
55
-
56
-
57
-
58
-
59
-
60
-
61
-
62
-
63
-
64
-
65
-
66
-
67
-
68
-
69
-
70
-
71
-
72
-
73
-
74
-
75
-
76
-
77
-
78
-
79
-
80
-
81
-
82
-
83
-
84
-
85
-
86
-
87
-
88
-
89
-
90
-
91
-
92
-
93
-
94
-
95
-
96
-
97
-
98
-
99
-
100
-
101
-
102
-
103
-
104
-
105
-
106
-
107
-
108
-
109
-
110
-
111
-
112
-
113
-
114
-
115
-
116
-
117
-
118
-
119
-
120
-
121
-
122
-
123
-
124
-
125
-
126
-
127
-
128
-
129
-
130
-
131
-
132
-
133
-
134
-
135
-
136
-
137
-
138
-
139
-
140
-
141
-
142
-
143
-
144
-
145
-
146
-
147
-
148
-
149
-
150
-
151
-
152
-
153
-
154
-
155
-
156
-
157
-
158
-
159
-
160
-
161
-
162
-
163
-
164
-
165
-
166
-
167
-
168
-
169
-
170
-
171
-
172
-
173
-
174
-
175
-
176
-
177
-
178
-
179
-
180
-
181
-
182
-
183
-
184
-
185
-
186
-
187
-
188
-
189
-
190
-
191
-
192
-
193
-
194
-
195
-
196
-
197
-
198
-
199
-
200
-
201
-
202
-
203
-
204
-
205
-
206
-
207
-
208
-
209
-
210
-
211
-
212
-
213
-
214
-
215
-
216
-
217
-
218
-
219
-
220
-
221
-
222
-
223
-
224
-
225
-
226
-
227
-
228
-
229
-
230
-
231
-
232
-
233
-
234
-
235
-
236
-
237
-
238
-
239
-
240
-
241
-
242
-
243
-
244
-
245
-
246
-
247
-
248
-
249
-
250
-
 251
251 -
 252
252 -
 253
253 -
 254
254 -
 255
255 -
 256
256 -
 257
257 -
 258
258 -
 259
259 -
 260
260 -
 261
261 -
 262
262 -
 263
263 -
 264
264 -
 265
265 -
 266
266 -
 267
267 -
 268
268 -
 269
269 -
 270
270 -
 271
271 -
272
-
273
-
274
-
275
-
276
-
277
-
278
-
279
-
280
-
281
-
282
-
283
-
284
-
285
-
286
-
287
-
288
-
289
-
290
-
291
-
292
-
293
-
294
-
295
-
296
-
297
-
298
-
299
-
300
-
301
-
302
-
303
-
304
-
305
-
306
-
307
-
308
-
309
-
310
-
311
-
312
-
313
-
314
-
315
-
316
-
317
-
318
-
319
-
320
-
321
-
322
-
323
-
324
-
325
-
326
-
327
-
328
-
329
-
330
 |
 |

Notes to Consolidated Financial Statements 165
(in millions of €, except where otherwise stated and per share amounts)
The discount rate assumptions reect the rates available on high-quality corporate bonds or government bonds
of consistent duration and currency at the balance sheet date. The expected return on plan assets is determined
on a uniform basis, considering long-term historical returns, asset allocation, and future estimates of long-term
investment returns. For scal 2009 and scal 2008 the expected return on plan assets remained primarily
unchanged. Changes of other actuarial assumptions, not shown in the tables above, such as employee turnover,
mortality, disability, etc., had only minor effects on the overall DBO as of September 30, 2008.
Experience adjustments, which result from differences between the actuarial assumptions and the actual occur-
rence, increased the DBO by 0.4% in scal 2008, did not impact the DBO in scal 2007 and scal 2006 and
increased the DBO by 0.8% in scal 2005.
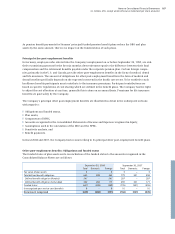
Pension benets: Sensitivity analysis
A one-percentage-point change of the established assumptions mentioned above, used for the calculation of the
NPBC for scal 2009, and a change in the fair value of plan assets of €500, as of September 30, 2008, respectively,
would result in the following increase (decrease) of the scal 2009 NPBC:
Increases and decreases in the discount rate, rate of compensation increase and rate of pension progression
which are used in determining the DBO do not have a symmetrical effect on NPBC primarily due to the com-
pound interest effect created when determining the net present value of the future pension benet. If more than
one of the assumptions were changed simultaneously, the cumulative impact would not necessarily be the same
as if only one assumption was changed in isolation.
Pension benets: Plan assets
The asset allocation of the plan assets of the principal pension benet plans as of the balance sheet date for scal
2008 and 2007 as well as the target asset allocation for scal year 2009, are as follows:
Derivatives are reported under the asset class whose risk is hedged. Current asset allocation is composed of high
quality government and selected corporate bonds. Siemens constantly reviews the asset allocation in light of the
duration of its pension liabilities and analyzes trends and events that may affect asset values in order to initiate
appropriate measures at a very early stage.
Effect on NPBC 2009 due to a
one-percentage-
point/€500 increase
one-percentage-
point/€500 decrease
Discount rate 8 (8)
Expected return on plan assets (187) 187
Rate of compensation increase 21 (20)
Rate of pension progression 130 (111)
Fair value of plan assets (32) 32
Target asset
allocation
September
30, 2009
Asset allocation
September 30, 2008 September 30, 2007
Asset class Total Domestic Foreign Total Domestic Foreign
Equity 20 – 50% 29% 29% 29% 33% 29% 39%
Fixed income 40 – 70% 61% 62% 61% 54% 61% 42%
Real estate 5 – 15% 9% 8% 10% 8% 7% 11%
Cash and other assets 5 – 15% 1% 1% 0% 5% 3% 8%
100% 100% 100% 100% 100% 100%