Siemens 2008 Annual Report Download - page 242
Download and view the complete annual report
Please find page 242 of the 2008 Siemens annual report below. You can navigate through the pages in the report by either clicking on the pages listed below, or by using the keyword search tool below to find specific information within the annual report.-
 1
1 -
2
-
3
-
4
-
5
-
6
-
7
-
8
-
9
-
10
-
11
-
12
-
13
-
14
-
15
-
16
-
17
-
18
-
19
-
20
-
21
-
22
-
23
-
24
-
25
-
26
-
27
-
28
-
29
-
30
-
31
-
32
-
33
-
34
-
35
-
36
-
37
-
38
-
39
-
40
-
41
-
42
-
43
-
44
-
45
-
46
-
47
-
48
-
49
-
50
-
51
-
52
-
53
-
54
-
55
-
56
-
57
-
58
-
59
-
60
-
61
-
62
-
63
-
64
-
65
-
66
-
67
-
68
-
69
-
70
-
71
-
72
-
73
-
74
-
75
-
76
-
77
-
78
-
79
-
80
-
81
-
82
-
83
-
84
-
85
-
86
-
87
-
88
-
89
-
90
-
91
-
92
-
93
-
94
-
95
-
96
-
97
-
98
-
99
-
100
-
101
-
102
-
103
-
104
-
105
-
106
-
107
-
108
-
109
-
110
-
111
-
112
-
113
-
114
-
115
-
116
-
117
-
118
-
119
-
120
-
121
-
122
-
123
-
124
-
125
-
126
-
127
-
128
-
129
-
130
-
131
-
132
-
133
-
134
-
135
-
136
-
137
-
138
-
139
-
140
-
141
-
142
-
143
-
144
-
145
-
146
-
147
-
148
-
149
-
150
-
151
-
152
-
153
-
154
-
155
-
156
-
157
-
158
-
159
-
160
-
161
-
162
-
163
-
164
-
165
-
166
-
167
-
168
-
169
-
170
-
171
-
172
-
173
-
174
-
175
-
176
-
177
-
178
-
179
-
180
-
181
-
182
-
183
-
184
-
185
-
186
-
187
-
188
-
189
-
190
-
191
-
192
-
193
-
194
-
195
-
196
-
197
-
198
-
199
-
200
-
201
-
202
-
203
-
204
-
205
-
206
-
207
-
208
-
209
-
210
-
211
-
212
-
213
-
214
-
215
-
216
-
217
-
218
-
219
-
220
-
221
-
222
-
223
-
224
-
225
-
226
-
227
-
228
-
229
-
230
-
231
-
 232
232 -
 233
233 -
 234
234 -
 235
235 -
 236
236 -
 237
237 -
 238
238 -
 239
239 -
 240
240 -
 241
241 -
 242
242 -
 243
243 -
 244
244 -
 245
245 -
 246
246 -
 247
247 -
 248
248 -
 249
249 -
 250
250 -
 251
251 -
 252
252 -
253
-
254
-
255
-
256
-
257
-
258
-
259
-
260
-
261
-
262
-
263
-
264
-
265
-
266
-
267
-
268
-
269
-
270
-
271
-
272
-
273
-
274
-
275
-
276
-
277
-
278
-
279
-
280
-
281
-
282
-
283
-
284
-
285
-
286
-
287
-
288
-
289
-
290
-
291
-
292
-
293
-
294
-
295
-
296
-
297
-
298
-
299
-
300
-
301
-
302
-
303
-
304
-
305
-
306
-
307
-
308
-
309
-
310
-
311
-
312
-
313
-
314
-
315
-
316
-
317
-
318
-
319
-
320
-
321
-
322
-
323
-
324
-
325
-
326
-
327
-
328
-
329
-
330
 |
 |

146 Notes to Consolidated Financial Statements
(in millions of €, except where otherwise stated and per share amounts)
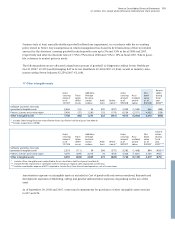
11 Available-for-sale financial assets
The following tables summarize the current portion of the Company’s investment in available-for-sale
nancial assets:
Proceeds from sales of available-for-sale nancial assets traded in an active market for the years ended Septem-
ber 30, 2008 and 2007 were €49 and €419, respectively. Gross realized gains on sales of such available-for-sale
nancial assets for continuing and discontinued operations for the years ended September 30, 2008 and 2007
were €13 and €10, respectively. Gross realized losses on sales of such available-for-sale nancial assets for
continuing and discontinued operations for the years ended September 30, 2008 and 2007 were €1 and €31,
respectively.
Net proceeds from the sale of debt instruments in scal 2008 and 2007 totaled € – and €365, respectively.
Available-for-sale nancial assets classied as non-current are included in Other nancial assets (see Note 20).
12 Trade and other receivables
September 30, 2008
Cost Fair Value Unrealized
Gain Loss
Equity instruments 32 26 – (6)
Debt instruments 84 85 1 –
Fund shares 40 41 1 –
156 152 2 (6)
September 30, 2007
Cost Fair Value Unrealized
Gain Loss
Equity instruments 44 65 21 –
Debt instruments 94 94 – –
Fund shares 34 34 – –
172 193 21 –
September 30,
2008 2007
Trade receivables from the sale of goods and services 14,062 12,864
Receivables from nance leases 1,674 1,658
Receivables from joint ventures and associates and other companies* 49 98
15,785 14,620
* Other companies, in the context of the above line item, are those in which Siemens has an ownership interest of less than 20% and exercises
no signicant inuence over their operating and nancial policies.