Siemens 2008 Annual Report Download - page 99
Download and view the complete annual report
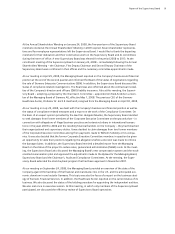
Please find page 99 of the 2008 Siemens annual report below. You can navigate through the pages in the report by either clicking on the pages listed below, or by using the keyword search tool below to find specific information within the annual report.-
 1
1 -
2
-
3
-
4
-
5
-
6
-
7
-
8
-
9
-
10
-
11
-
12
-
13
-
14
-
15
-
16
-
17
-
18
-
19
-
20
-
21
-
22
-
23
-
24
-
25
-
26
-
27
-
28
-
29
-
30
-
31
-
32
-
33
-
34
-
35
-
36
-
37
-
38
-
39
-
40
-
41
-
42
-
43
-
44
-
45
-
46
-
47
-
48
-
49
-
50
-
51
-
52
-
53
-
54
-
55
-
56
-
57
-
58
-
59
-
60
-
61
-
62
-
63
-
64
-
65
-
66
-
67
-
68
-
69
-
70
-
71
-
72
-
73
-
74
-
75
-
76
-
77
-
78
-
79
-
80
-
81
-
82
-
83
-
84
-
85
-
86
-
87
-
88
-
 89
89 -
 90
90 -
 91
91 -
 92
92 -
 93
93 -
 94
94 -
 95
95 -
 96
96 -
 97
97 -
 98
98 -
 99
99 -
 100
100 -
 101
101 -
 102
102 -
 103
103 -
 104
104 -
 105
105 -
 106
106 -
 107
107 -
 108
108 -
 109
109 -
110
-
111
-
112
-
113
-
114
-
115
-
116
-
117
-
118
-
119
-
120
-
121
-
122
-
123
-
124
-
125
-
126
-
127
-
128
-
129
-
130
-
131
-
132
-
133
-
134
-
135
-
136
-
137
-
138
-
139
-
140
-
141
-
142
-
143
-
144
-
145
-
146
-
147
-
148
-
149
-
150
-
151
-
152
-
153
-
154
-
155
-
156
-
157
-
158
-
159
-
160
-
161
-
162
-
163
-
164
-
165
-
166
-
167
-
168
-
169
-
170
-
171
-
172
-
173
-
174
-
175
-
176
-
177
-
178
-
179
-
180
-
181
-
182
-
183
-
184
-
185
-
186
-
187
-
188
-
189
-
190
-
191
-
192
-
193
-
194
-
195
-
196
-
197
-
198
-
199
-
200
-
201
-
202
-
203
-
204
-
205
-
206
-
207
-
208
-
209
-
210
-
211
-
212
-
213
-
214
-
215
-
216
-
217
-
218
-
219
-
220
-
221
-
222
-
223
-
224
-
225
-
226
-
227
-
228
-
229
-
230
-
231
-
232
-
233
-
234
-
235
-
236
-
237
-
238
-
239
-
240
-
241
-
242
-
243
-
244
-
245
-
246
-
247
-
248
-
249
-
250
-
251
-
252
-
253
-
254
-
255
-
256
-
257
-
258
-
259
-
260
-
261
-
262
-
263
-
264
-
265
-
266
-
267
-
268
-
269
-
270
-
271
-
272
-
273
-
274
-
275
-
276
-
277
-
278
-
279
-
280
-
281
-
282
-
283
-
284
-
285
-
286
-
287
-
288
-
289
-
290
-
291
-
292
-
293
-
294
-
295
-
296
-
297
-
298
-
299
-
300
-
301
-
302
-
303
-
304
-
305
-
306
-
307
-
308
-
309
-
310
-
311
-
312
-
313
-
314
-
315
-
316
-
317
-
318
-
319
-
320
-
321
-
322
-
323
-
324
-
325
-
326
-
327
-
328
-
329
-
330
 |
 |

(1) EBITDA (adjusted), Return on capital employed (ROCE), Return on equity (ROE), Free cash
flow, Cash conversion rate and Adjusted industrial net debt are non-GAAP financial measures.
Information for a reconciliation of these amounts to the most directly comparable IFRS
financial measures is available on our Investor Relations website under www.siemens.com/ir,
Financial Publications. Profit of the Sectors and Siemens IT Solutions and Services is recon-
ciled to Income before income taxes in the table „Segment Information.“ Profit of Siemens
Financial Services is Income before income taxes.
(2) October 1, 2007 – September 30, 2008.
(3) Adjusted for portfolio and currency translation effects.
(4) Earnings per share – attributable to shareholders of Siemens AG. For fiscal 2008 and
2007 weighted average shares outstanding (basic) (in thousands) amounted to 893,166
and 898,135 respectively.
(5) Discontinued operations consist of Siemens VDO Automotive activities as well as of carrier
networks, enterprise networks and mobile devices activities.
(6) Continuing and discontinued operations.
(7) Return on equity is calculated as Income before income taxes of fiscal 2008 divided by
average allocated equity for fiscal 2008 (€ 911 million).
FY 2008(3) FY 2007(3)
Target:
2 x GDP*
9% 10%
* According to Global Insight Inc. as of November 14, 2008
for calendar year 2008 GDP is expected to grow by 2.7%,
for calendar year 2007 GDP grew by 3.9%.
Key gures(1) Fiscal 2008(2)
(in millions of €, except where otherwise stated)
Revenue growth
FY 2008 FY 2007
Target
corridor 2010:
14 – 16%
4.8% 12.7%
ROCE (continuing operations)
FY 2008 FY 2007
Target
corridor
2010:
0.8 – 1.0 0.42 0.76
Adjusted industrial net debt/
EBITDA (adjusted) (continuing operations)
FY 2008 FY 2007
Target 2010:
1 minus
revenue
growth rate 3.09 1.73
Cash conversion (continuing operations)
Profit margin FY 2008
Industry
Industry Automation
Drive Technologies
Building Technologies
OSRAM
Industry Solutions
Mobility
Energy
Fossil Power Generation
Renewable Energy
Oil & Gas
Power Transmission
Power Distribution
Healthcare
Imaging & IT
Workow & Solutions
Diagnostics
Siemens IT Solutions and Services
Siemens Financial Services*
* Return on equity(7) Margin ranges
10.1%
18.5%
13.5%
7.8%
8.7%
6.2%
– 3.9%
6.4%
– 1.1%
11.6%
8.7%
10.3%
11.5%
11.0%
13.2%
4.4%
7.8%
2.7%
31.4%
Growth and profit
FY 2008 FY 2007 % Change
Actual Adjusted(3)
Continuing operations
New orders 93,495 83,916 11 13
Revenue 77,327 72,448 7 9
Total Sectors
Profit Total Sectors 6,520 6,662 (2)
in % of revenue (Total Sectors) 9.1% 10.1%
EBITDA (adjusted) 8,528 8,230 4
in % of revenue (Total Sectors) 11.9% 12.4%
Continuing operations
EBITDA (adjusted) 5,585 7,686 (27)
Income from continuing operations 1,859 3,909 (52)
Basic earnings per share (in euros)(4) 1.91 4.13 (54)
Continuing and discontinued operations(5)
Net income 5,886 4,038 46
Basic earnings per share (in euros)(4) 6.41 4.24 51
Return on capital employed
FY 2008 FY 2007
Continuing operations
Return on capital employed (ROCE) 4.8% 12.7%
Continuing and discontinued operations(5)
Return on capital employed (ROCE) 14.8% 10.9%
Free cash flow and Cash conversion
FY 2008 FY 2007
Total Sectors
Free cash flow 7,892 7,235
Cash conversion 1.21 1.09
Continuing operations
Free cash flow 5,739 6,755
Cash conversion 3.09 1.73
Continuing and discontinued operations(5)
Free cash flow 4,903 3,577
Cash conversion 0.83 0.89
Net debt and Capital structure
FY 2008 FY 2007
Net debt 9,034 11,299
Net debt/EBITDA (adjusted) 1.62 1.47
Adjusted industrial net debt 2,364 5,828
Adj. industrial net debt/EBITDA (adjusted)(cont.) 0.42 0.76
Employees (in thousands)
Sept. 30, 2008 Sept. 30, 2007
Cont.
Op. Total(6) Cont.
Op. Total(6)
Employees 427 428 398 471
Germany 132 133 126 152
Outside Germany 295 295 272 319