Siemens 2008 Annual Report Download - page 258
Download and view the complete annual report
Please find page 258 of the 2008 Siemens annual report below. You can navigate through the pages in the report by either clicking on the pages listed below, or by using the keyword search tool below to find specific information within the annual report.-
 1
1 -
2
-
3
-
4
-
5
-
6
-
7
-
8
-
9
-
10
-
11
-
12
-
13
-
14
-
15
-
16
-
17
-
18
-
19
-
20
-
21
-
22
-
23
-
24
-
25
-
26
-
27
-
28
-
29
-
30
-
31
-
32
-
33
-
34
-
35
-
36
-
37
-
38
-
39
-
40
-
41
-
42
-
43
-
44
-
45
-
46
-
47
-
48
-
49
-
50
-
51
-
52
-
53
-
54
-
55
-
56
-
57
-
58
-
59
-
60
-
61
-
62
-
63
-
64
-
65
-
66
-
67
-
68
-
69
-
70
-
71
-
72
-
73
-
74
-
75
-
76
-
77
-
78
-
79
-
80
-
81
-
82
-
83
-
84
-
85
-
86
-
87
-
88
-
89
-
90
-
91
-
92
-
93
-
94
-
95
-
96
-
97
-
98
-
99
-
100
-
101
-
102
-
103
-
104
-
105
-
106
-
107
-
108
-
109
-
110
-
111
-
112
-
113
-
114
-
115
-
116
-
117
-
118
-
119
-
120
-
121
-
122
-
123
-
124
-
125
-
126
-
127
-
128
-
129
-
130
-
131
-
132
-
133
-
134
-
135
-
136
-
137
-
138
-
139
-
140
-
141
-
142
-
143
-
144
-
145
-
146
-
147
-
148
-
149
-
150
-
151
-
152
-
153
-
154
-
155
-
156
-
157
-
158
-
159
-
160
-
161
-
162
-
163
-
164
-
165
-
166
-
167
-
168
-
169
-
170
-
171
-
172
-
173
-
174
-
175
-
176
-
177
-
178
-
179
-
180
-
181
-
182
-
183
-
184
-
185
-
186
-
187
-
188
-
189
-
190
-
191
-
192
-
193
-
194
-
195
-
196
-
197
-
198
-
199
-
200
-
201
-
202
-
203
-
204
-
205
-
206
-
207
-
208
-
209
-
210
-
211
-
212
-
213
-
214
-
215
-
216
-
217
-
218
-
219
-
220
-
221
-
222
-
223
-
224
-
225
-
226
-
227
-
228
-
229
-
230
-
231
-
232
-
233
-
234
-
235
-
236
-
237
-
238
-
239
-
240
-
241
-
242
-
243
-
244
-
245
-
246
-
247
-
 248
248 -
 249
249 -
 250
250 -
 251
251 -
 252
252 -
 253
253 -
 254
254 -
 255
255 -
 256
256 -
 257
257 -
 258
258 -
 259
259 -
 260
260 -
 261
261 -
 262
262 -
 263
263 -
 264
264 -
 265
265 -
 266
266 -
 267
267 -
 268
268 -
269
-
270
-
271
-
272
-
273
-
274
-
275
-
276
-
277
-
278
-
279
-
280
-
281
-
282
-
283
-
284
-
285
-
286
-
287
-
288
-
289
-
290
-
291
-
292
-
293
-
294
-
295
-
296
-
297
-
298
-
299
-
300
-
301
-
302
-
303
-
304
-
305
-
306
-
307
-
308
-
309
-
310
-
311
-
312
-
313
-
314
-
315
-
316
-
317
-
318
-
319
-
320
-
321
-
322
-
323
-
324
-
325
-
326
-
327
-
328
-
329
-
330
 |
 |

162 Notes to Consolidated Financial Statements
(in millions of €, except where otherwise stated and per share amounts)
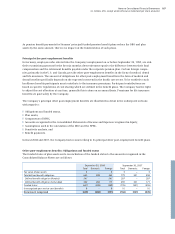
A detailed reconciliation of the changes in the DBO for scal 2008 and 2007 as well as additional information
by country is provided in the following table:
The total dened benet obligation at the end of the current scal year includes approximately €7,480 for active
employees, €2,718 for former employees with vested benets and €12,456 for retirees and surviving dependents.
In scal 2008 and 2007, the DBO decreased due to an increase in discount rate for the domestic and foreign
pension plans. In scal 2008, the positive effect of a discount rate increase was partly offset by an increase in
pension progression and compensation increase rate as well as by experience adjustments.
The following table shows the change in plan assets for scal year 2008 and 2007 and additional information
by country:
September 30, 2008 September 30, 2007
Total Domestic Foreign Total Domestic Foreign
Change in dened benet obligations:
Dened benet obligation at beginning of year 25,052 15,488 9,564 26,696 16,372 10,324
Foreign currency exchange rate changes (340) – (340) (556) – (556)
Service cost 511 279 232 684 358 326
Interest cost 1,246 765 481 1,233 725 508
Settlements and curtailments (46) (26) (20) (13) – (13)
Plan participants’ contributions 135 87 48 180 119 61
Amendments and other 22 12 10 283 (7) 290
Actuarial (gains) losses (1,748) (1,612) (136) (1,660) (863) (797)
Acquisitions 109 68 41 101 55 46
Divestments (1,026) (408) (618) (670) (453) (217)
Benets paid (1,261) (871) (390) (1,226) (818) (408)
Defined benefit obligation at end of year 22,654 13,782 8,872 25,052 15,488 9,564
Germany 13,782 15,488
U.S. 2,933 3,250
U.K. 3,003 3,229
Other 2,936 3,085
September 30, 2008 September 30, 2007
Total Domestic Foreign Total Domestic Foreign
Change in plan assets:
Fair value of plan assets at beginning of year 24,013 14,753 9,260 23,755 15,023 8,732
Foreign currency exchange rate changes (384) – (384) (508) – (508)
Expected return on plan assets 1,471 929 542 1,513 947 566
Actuarial gains (losses) on plan assets (3,648) (2,556) (1,092) (218) (369) 151
Acquisitions and other 56 12 44 293 – 293
Divestments and other (750) (126) (624) (610) (417) (193)
Employer contributions (regular) 562 112 450 837 271 566
Plan participants’ contributions 135 87 48 177 116 61
Benets paid (1,261) (871) (390) (1,226) (818) (408)
Fair value of plan assets at end of year 20,194 12,340 7,854 24,013 14,753 9,260
Germany 12,340 14,753
U.S. 2,345 3,048
U.K. 2,847 3,189
Other 2,662 3,023