Siemens 2008 Annual Report Download - page 259
Download and view the complete annual report
Please find page 259 of the 2008 Siemens annual report below. You can navigate through the pages in the report by either clicking on the pages listed below, or by using the keyword search tool below to find specific information within the annual report.-
 1
1 -
2
-
3
-
4
-
5
-
6
-
7
-
8
-
9
-
10
-
11
-
12
-
13
-
14
-
15
-
16
-
17
-
18
-
19
-
20
-
21
-
22
-
23
-
24
-
25
-
26
-
27
-
28
-
29
-
30
-
31
-
32
-
33
-
34
-
35
-
36
-
37
-
38
-
39
-
40
-
41
-
42
-
43
-
44
-
45
-
46
-
47
-
48
-
49
-
50
-
51
-
52
-
53
-
54
-
55
-
56
-
57
-
58
-
59
-
60
-
61
-
62
-
63
-
64
-
65
-
66
-
67
-
68
-
69
-
70
-
71
-
72
-
73
-
74
-
75
-
76
-
77
-
78
-
79
-
80
-
81
-
82
-
83
-
84
-
85
-
86
-
87
-
88
-
89
-
90
-
91
-
92
-
93
-
94
-
95
-
96
-
97
-
98
-
99
-
100
-
101
-
102
-
103
-
104
-
105
-
106
-
107
-
108
-
109
-
110
-
111
-
112
-
113
-
114
-
115
-
116
-
117
-
118
-
119
-
120
-
121
-
122
-
123
-
124
-
125
-
126
-
127
-
128
-
129
-
130
-
131
-
132
-
133
-
134
-
135
-
136
-
137
-
138
-
139
-
140
-
141
-
142
-
143
-
144
-
145
-
146
-
147
-
148
-
149
-
150
-
151
-
152
-
153
-
154
-
155
-
156
-
157
-
158
-
159
-
160
-
161
-
162
-
163
-
164
-
165
-
166
-
167
-
168
-
169
-
170
-
171
-
172
-
173
-
174
-
175
-
176
-
177
-
178
-
179
-
180
-
181
-
182
-
183
-
184
-
185
-
186
-
187
-
188
-
189
-
190
-
191
-
192
-
193
-
194
-
195
-
196
-
197
-
198
-
199
-
200
-
201
-
202
-
203
-
204
-
205
-
206
-
207
-
208
-
209
-
210
-
211
-
212
-
213
-
214
-
215
-
216
-
217
-
218
-
219
-
220
-
221
-
222
-
223
-
224
-
225
-
226
-
227
-
228
-
229
-
230
-
231
-
232
-
233
-
234
-
235
-
236
-
237
-
238
-
239
-
240
-
241
-
242
-
243
-
244
-
245
-
246
-
247
-
248
-
 249
249 -
 250
250 -
 251
251 -
 252
252 -
 253
253 -
 254
254 -
 255
255 -
 256
256 -
 257
257 -
 258
258 -
 259
259 -
 260
260 -
 261
261 -
 262
262 -
 263
263 -
 264
264 -
 265
265 -
 266
266 -
 267
267 -
 268
268 -
 269
269 -
270
-
271
-
272
-
273
-
274
-
275
-
276
-
277
-
278
-
279
-
280
-
281
-
282
-
283
-
284
-
285
-
286
-
287
-
288
-
289
-
290
-
291
-
292
-
293
-
294
-
295
-
296
-
297
-
298
-
299
-
300
-
301
-
302
-
303
-
304
-
305
-
306
-
307
-
308
-
309
-
310
-
311
-
312
-
313
-
314
-
315
-
316
-
317
-
318
-
319
-
320
-
321
-
322
-
323
-
324
-
325
-
326
-
327
-
328
-
329
-
330
 |
 |

Notes to Consolidated Financial Statements 163
(in millions of €, except where otherwise stated and per share amounts)
In scal 2008, the DBO and the fair value of plan assets decreased due to the disposal of SV and SEN pension lia-
bilities and pension assets. These effects are included in the items Divestments and Divestments and other in the
preceding two tables. In scal 2007, the DBO and the fair value of plan assets decreased due to the contribution
of the carrier-related operations of Siemens to NSN.
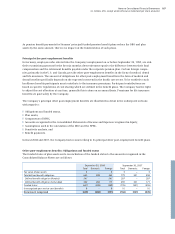
Pension benets: Components of NPBC
The components of the NPBC for the scal years ended September 30, 2008 and 2007 are as follows:
Net periodic benet cost for scal 2008, in the table above, includes €(21) related to discontinued operations.
The amount includes €(59) settlement gain as a result from the disposal of the SV and SEN pension liabilities
and €38 other net periodic pension cost of SV and SEN.
Pension benets: Amounts recognized in the Consolidated Statements of Income and Expense recognized
in Equity
The actuarial gains and losses on dened benet pension plans recognized in the Consolidated Statements
of Income and Expense recognized in Equity for the scal years ended September 30, 2008 and 2007 were as
follows:
Pension benets: Assumptions for the calculation of the DBO and NPBC
Assumed discount rates, compensation increase rates and pension progression rates used in calculating the DBO
together with long-term rates of return on plan assets vary according to the economic conditions of the country
in which the retirement plans are situated or where plan assets are invested as well as capital market expectations.
Year ended September 30, 2008 Year ended September 30, 2007
Total Domestic Foreign Total Domestic Foreign
Service cost 511 279 232 684 358 326
Interest cost 1,246 765 481 1,233 725 508
Expected return on plan assets (1,471) (929) (542) (1,513) (947) (566)
Amortization of past service cost (benets) (1) – (1) (5) – (5)
Loss (gain) due to settlements and curtailments (46) (26) (20) (4) – (4)
Net periodic benefit cost 239 89 150 395 136 259
Germany 89 136
U.S. 132 137
U.K 15 105
Other 3 17
Year ended September 30, 2008 Year ended September 30, 2007
Total Domestic Foreign Total Domestic Foreign
Actuarial losses (gains) 1,900 944 956 (1,442) (494) (948)
Effects due to asset ceiling – – – 13 – 13
Income tax effect (50) 252 (302) 206 (83) 289
Net amount recognized in the Consolidated
Statements of Income and Expense recognized
in Equity (net of tax) 1,850 1,196 654 1,223 (577) (646)
Germany 1,196 (577)
U.S. 198 (185)
U.K. 263 (322)
Other 193 (139)