Siemens 2008 Annual Report Download - page 260
Download and view the complete annual report
Please find page 260 of the 2008 Siemens annual report below. You can navigate through the pages in the report by either clicking on the pages listed below, or by using the keyword search tool below to find specific information within the annual report.-
 1
1 -
2
-
3
-
4
-
5
-
6
-
7
-
8
-
9
-
10
-
11
-
12
-
13
-
14
-
15
-
16
-
17
-
18
-
19
-
20
-
21
-
22
-
23
-
24
-
25
-
26
-
27
-
28
-
29
-
30
-
31
-
32
-
33
-
34
-
35
-
36
-
37
-
38
-
39
-
40
-
41
-
42
-
43
-
44
-
45
-
46
-
47
-
48
-
49
-
50
-
51
-
52
-
53
-
54
-
55
-
56
-
57
-
58
-
59
-
60
-
61
-
62
-
63
-
64
-
65
-
66
-
67
-
68
-
69
-
70
-
71
-
72
-
73
-
74
-
75
-
76
-
77
-
78
-
79
-
80
-
81
-
82
-
83
-
84
-
85
-
86
-
87
-
88
-
89
-
90
-
91
-
92
-
93
-
94
-
95
-
96
-
97
-
98
-
99
-
100
-
101
-
102
-
103
-
104
-
105
-
106
-
107
-
108
-
109
-
110
-
111
-
112
-
113
-
114
-
115
-
116
-
117
-
118
-
119
-
120
-
121
-
122
-
123
-
124
-
125
-
126
-
127
-
128
-
129
-
130
-
131
-
132
-
133
-
134
-
135
-
136
-
137
-
138
-
139
-
140
-
141
-
142
-
143
-
144
-
145
-
146
-
147
-
148
-
149
-
150
-
151
-
152
-
153
-
154
-
155
-
156
-
157
-
158
-
159
-
160
-
161
-
162
-
163
-
164
-
165
-
166
-
167
-
168
-
169
-
170
-
171
-
172
-
173
-
174
-
175
-
176
-
177
-
178
-
179
-
180
-
181
-
182
-
183
-
184
-
185
-
186
-
187
-
188
-
189
-
190
-
191
-
192
-
193
-
194
-
195
-
196
-
197
-
198
-
199
-
200
-
201
-
202
-
203
-
204
-
205
-
206
-
207
-
208
-
209
-
210
-
211
-
212
-
213
-
214
-
215
-
216
-
217
-
218
-
219
-
220
-
221
-
222
-
223
-
224
-
225
-
226
-
227
-
228
-
229
-
230
-
231
-
232
-
233
-
234
-
235
-
236
-
237
-
238
-
239
-
240
-
241
-
242
-
243
-
244
-
245
-
246
-
247
-
248
-
249
-
 250
250 -
 251
251 -
 252
252 -
 253
253 -
 254
254 -
 255
255 -
 256
256 -
 257
257 -
 258
258 -
 259
259 -
 260
260 -
 261
261 -
 262
262 -
 263
263 -
 264
264 -
 265
265 -
 266
266 -
 267
267 -
 268
268 -
 269
269 -
 270
270 -
271
-
272
-
273
-
274
-
275
-
276
-
277
-
278
-
279
-
280
-
281
-
282
-
283
-
284
-
285
-
286
-
287
-
288
-
289
-
290
-
291
-
292
-
293
-
294
-
295
-
296
-
297
-
298
-
299
-
300
-
301
-
302
-
303
-
304
-
305
-
306
-
307
-
308
-
309
-
310
-
311
-
312
-
313
-
314
-
315
-
316
-
317
-
318
-
319
-
320
-
321
-
322
-
323
-
324
-
325
-
326
-
327
-
328
-
329
-
330
 |
 |

164 Notes to Consolidated Financial Statements
(in millions of €, except where otherwise stated and per share amounts)
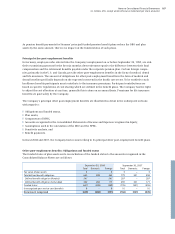
The weighted-average assumptions used for the actuarial valuation of the DBO as of the balance sheet date were
as follows:
The assumptions used for the calculation of the DBO as of the balance sheet date of the preceding scal year are
used to determine the calculation of interest cost and service cost of the following year. Therefore, the assump-
tions used for the calculation of the NPBC for scal 2009 are already determined. The total expected return for
scal 2009 will be based on expected rates of return multiplied by the fair value of plan assets at the scal 2008
balance sheet date (see table below). The fair value and thus the expected return on plan assets are adjusted for
signicant events after the balance sheet date, such as a supplemental funding. Due to the implementation of
the BSAV, the effect of the compensation increase on the domestic pension plans is substantially eliminated.
The weighted-average assumptions used for determining the NPBC for the scal years ended September 30,
2009, 2008 and 2007 are shown in the following table:
Year ended September 30, 2008 Year ended September 30, 2007
Total Domestic Foreign Total Domestic Foreign
Discount rate 6.2% 6.4% 6.0% 5.3% 5.1% 5.6%
Germany 6.4% 5.1%
U.S. 6.79% 6.29%
U.K. 6.5% 6.0%
Rate of compensation increase 2.9% 2.25% 3.8% 2.7% 2.25% 3.5%
Germany 2.25% 2.25%
U.S. 4.05% 3.96%
U.K. 4.5% 4.0%
Rate of pension progression 1.9% 1.75% 2.2% 1.6% 1.5% 2.0%
Germany 1.75% 1.5%
U.K. 3.6% 3.1%
Year ending September 30, 2009 Year ended September 30, 2008 Year ended September 30, 2007
Total Domestic Foreign Total Domestic Foreign Total Domestic Foreign
Discount rate 6.2% 6.4% 6.0% 5.3% 5.1% 5.6% 4.7% 4.5% 5.0%
Germany 6.4% 5.1% 4.5%
U.S. 6.79% 6.29% 5.95%
U.K. 6.5% 6.0% 5.0%
Expected return on plan assets 6.5% 6.5% 6.4% 6.5% 6.5% 6.5% 6.5% 6.5% 6.5%
Germany 6.5% 6.5% 6.5%
U.S. 6.97% 6.97% 6.95%
U.K. 6.5% 6.7% 6.7%
Rate of compensation increase 2.9% 2.25% 3.8% 2.7% 2.25% 3.5% 2.7% 2.25% 3.4%
Germany 2.25% 2.25% 2.25%
U.S. 4.05% 3.96% 3.95%
U.K. 4.5% 4.0% 3.7%
Rate of pension progression 1.9% 1.75% 2.2% 1.6% 1.5% 2.0% 1.2% 1.0% 1.8%
Germany 1.75% 1.5% 1.0%
U.K. 3.6% 3.1% 2.8%