Siemens 2008 Annual Report Download - page 174
Download and view the complete annual report
Please find page 174 of the 2008 Siemens annual report below. You can navigate through the pages in the report by either clicking on the pages listed below, or by using the keyword search tool below to find specific information within the annual report.-
 1
1 -
2
-
3
-
4
-
5
-
6
-
7
-
8
-
9
-
10
-
11
-
12
-
13
-
14
-
15
-
16
-
17
-
18
-
19
-
20
-
21
-
22
-
23
-
24
-
25
-
26
-
27
-
28
-
29
-
30
-
31
-
32
-
33
-
34
-
35
-
36
-
37
-
38
-
39
-
40
-
41
-
42
-
43
-
44
-
45
-
46
-
47
-
48
-
49
-
50
-
51
-
52
-
53
-
54
-
55
-
56
-
57
-
58
-
59
-
60
-
61
-
62
-
63
-
64
-
65
-
66
-
67
-
68
-
69
-
70
-
71
-
72
-
73
-
74
-
75
-
76
-
77
-
78
-
79
-
80
-
81
-
82
-
83
-
84
-
85
-
86
-
87
-
88
-
89
-
90
-
91
-
92
-
93
-
94
-
95
-
96
-
97
-
98
-
99
-
100
-
101
-
102
-
103
-
104
-
105
-
106
-
107
-
108
-
109
-
110
-
111
-
112
-
113
-
114
-
115
-
116
-
117
-
118
-
119
-
120
-
121
-
122
-
123
-
124
-
125
-
126
-
127
-
128
-
129
-
130
-
131
-
132
-
133
-
134
-
135
-
136
-
137
-
138
-
139
-
140
-
141
-
142
-
143
-
144
-
145
-
146
-
147
-
148
-
149
-
150
-
151
-
152
-
153
-
154
-
155
-
156
-
157
-
158
-
159
-
160
-
161
-
162
-
163
-
 164
164 -
 165
165 -
 166
166 -
 167
167 -
 168
168 -
 169
169 -
 170
170 -
 171
171 -
 172
172 -
 173
173 -
 174
174 -
 175
175 -
 176
176 -
 177
177 -
 178
178 -
 179
179 -
 180
180 -
 181
181 -
 182
182 -
 183
183 -
 184
184 -
185
-
186
-
187
-
188
-
189
-
190
-
191
-
192
-
193
-
194
-
195
-
196
-
197
-
198
-
199
-
200
-
201
-
202
-
203
-
204
-
205
-
206
-
207
-
208
-
209
-
210
-
211
-
212
-
213
-
214
-
215
-
216
-
217
-
218
-
219
-
220
-
221
-
222
-
223
-
224
-
225
-
226
-
227
-
228
-
229
-
230
-
231
-
232
-
233
-
234
-
235
-
236
-
237
-
238
-
239
-
240
-
241
-
242
-
243
-
244
-
245
-
246
-
247
-
248
-
249
-
250
-
251
-
252
-
253
-
254
-
255
-
256
-
257
-
258
-
259
-
260
-
261
-
262
-
263
-
264
-
265
-
266
-
267
-
268
-
269
-
270
-
271
-
272
-
273
-
274
-
275
-
276
-
277
-
278
-
279
-
280
-
281
-
282
-
283
-
284
-
285
-
286
-
287
-
288
-
289
-
290
-
291
-
292
-
293
-
294
-
295
-
296
-
297
-
298
-
299
-
300
-
301
-
302
-
303
-
304
-
305
-
306
-
307
-
308
-
309
-
310
-
311
-
312
-
313
-
314
-
315
-
316
-
317
-
318
-
319
-
320
-
321
-
322
-
323
-
324
-
325
-
326
-
327
-
328
-
329
-
330
 |
 |

78 Management’s discussion and analysis
Our new capital efciency measure is return on capital employed (ROCE). We adopted this measure in order to
assess our income generation from the point of view of our shareholders and creditors, who provide us with
capital. ROCE is dened as Income from continuing operations (before interest) divided by average capital
employed. Income from continuing operations (before interest) is dened as Income from continuing opera-
tions (as presented in the Consolidated Financial Statements) excluding Other interest income (expense), net
(as presented in the Notes to Consolidated Financial Statements) and excluding taxes on Other interest income
(expense), net. Capital employed is dened as Total equity plus Long-term debt plus Short-term debt and cur-
rent maturities of long-term debt minus Cash and cash equivalents, each as presented in the Consolidated
Financial Statements, and plus Liabilities associated with assets classied as held for disposal minus Assets
classied as held for disposal, both relating to discontinued operations and as presented in the Notes to Con-
solidated Financial Statements. Our goal is to achieve ROCE in the range of 14–16% by 2010.
Our third operational performance measure is cash conversion rate (CCR), which shows us how much of our
income we are converting to free cash ow. The calculation of CCR is shown below. Free cash ow presented in
the Notes to Consolidated Financial Statements is dened as net cash provided by (used in) operating activities
(continuing operations) minus Additions to intangible assets and property, plant and equipment (PPE) (continu-
ing operations). Our 2010 target for CCR is 1 minus our annual organic revenue growth rate.
In addition to the operational performance measures just discussed, we use several other metrics to assess the
economic success of our business activities. To determine whether a particular investment is likely to generate
value for Siemens, we use ROCE or economic value added (EVA). The latter considers the cost of capital in calcu-
lating value creation, by comparing the expected earnings of an investment against the cost of capital employed.
EVA was also used to measure the performance of our former Groups. The measure thereby compares the net
operating prot after tax of a former Group to the costs of capital for the average capital employed in the busi-
ness of that Group. To measure our liquidity management, we analyze the net working capital turns of our oper-
ating activities, as well as additions to intangible assets and PPE as a percentage of amortization and deprecia-
tion. For the latter measure, we have set a mid-term target of 95–115%.
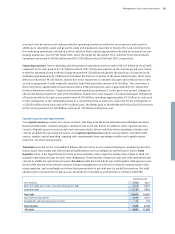
ROCE (continuing operations)
Formula:
Income from continuing
operations (before interest)
= × 100%
Average capital employed*
* adjusted by the net of assets classied as held for disposal less
liabilities associated with assets classied as held for disposal
12.7%
Fiscal year 2007
4.8%
Fiscal year 2008
Target
corridor
2010:
14 –16%
Cash Conversion Rate (continuing operations)
Formula:
Free cash ow from
continuing operations
=
Income from
continuing operations 1.73
Fiscal year 2007
3.09
Fiscal year 2008
Target
2010:
1 minus
revenue
growth
rate