Siemens 2008 Annual Report Download - page 265
Download and view the complete annual report
Please find page 265 of the 2008 Siemens annual report below. You can navigate through the pages in the report by either clicking on the pages listed below, or by using the keyword search tool below to find specific information within the annual report.-
 1
1 -
2
-
3
-
4
-
5
-
6
-
7
-
8
-
9
-
10
-
11
-
12
-
13
-
14
-
15
-
16
-
17
-
18
-
19
-
20
-
21
-
22
-
23
-
24
-
25
-
26
-
27
-
28
-
29
-
30
-
31
-
32
-
33
-
34
-
35
-
36
-
37
-
38
-
39
-
40
-
41
-
42
-
43
-
44
-
45
-
46
-
47
-
48
-
49
-
50
-
51
-
52
-
53
-
54
-
55
-
56
-
57
-
58
-
59
-
60
-
61
-
62
-
63
-
64
-
65
-
66
-
67
-
68
-
69
-
70
-
71
-
72
-
73
-
74
-
75
-
76
-
77
-
78
-
79
-
80
-
81
-
82
-
83
-
84
-
85
-
86
-
87
-
88
-
89
-
90
-
91
-
92
-
93
-
94
-
95
-
96
-
97
-
98
-
99
-
100
-
101
-
102
-
103
-
104
-
105
-
106
-
107
-
108
-
109
-
110
-
111
-
112
-
113
-
114
-
115
-
116
-
117
-
118
-
119
-
120
-
121
-
122
-
123
-
124
-
125
-
126
-
127
-
128
-
129
-
130
-
131
-
132
-
133
-
134
-
135
-
136
-
137
-
138
-
139
-
140
-
141
-
142
-
143
-
144
-
145
-
146
-
147
-
148
-
149
-
150
-
151
-
152
-
153
-
154
-
155
-
156
-
157
-
158
-
159
-
160
-
161
-
162
-
163
-
164
-
165
-
166
-
167
-
168
-
169
-
170
-
171
-
172
-
173
-
174
-
175
-
176
-
177
-
178
-
179
-
180
-
181
-
182
-
183
-
184
-
185
-
186
-
187
-
188
-
189
-
190
-
191
-
192
-
193
-
194
-
195
-
196
-
197
-
198
-
199
-
200
-
201
-
202
-
203
-
204
-
205
-
206
-
207
-
208
-
209
-
210
-
211
-
212
-
213
-
214
-
215
-
216
-
217
-
218
-
219
-
220
-
221
-
222
-
223
-
224
-
225
-
226
-
227
-
228
-
229
-
230
-
231
-
232
-
233
-
234
-
235
-
236
-
237
-
238
-
239
-
240
-
241
-
242
-
243
-
244
-
245
-
246
-
247
-
248
-
249
-
250
-
251
-
252
-
253
-
254
-
 255
255 -
 256
256 -
 257
257 -
 258
258 -
 259
259 -
 260
260 -
 261
261 -
 262
262 -
 263
263 -
 264
264 -
 265
265 -
 266
266 -
 267
267 -
 268
268 -
 269
269 -
 270
270 -
 271
271 -
 272
272 -
 273
273 -
 274
274 -
 275
275 -
276
-
277
-
278
-
279
-
280
-
281
-
282
-
283
-
284
-
285
-
286
-
287
-
288
-
289
-
290
-
291
-
292
-
293
-
294
-
295
-
296
-
297
-
298
-
299
-
300
-
301
-
302
-
303
-
304
-
305
-
306
-
307
-
308
-
309
-
310
-
311
-
312
-
313
-
314
-
315
-
316
-
317
-
318
-
319
-
320
-
321
-
322
-
323
-
324
-
325
-
326
-
327
-
328
-
329
-
330
 |
 |

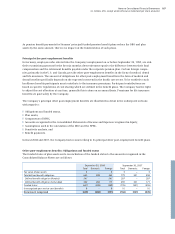
Notes to Consolidated Financial Statements 169
(in millions of €, except where otherwise stated and per share amounts)
Other post-employment benets: Amounts recognized in the Consolidated Statements of Income and
Expense recognized in Equity
The actuarial gains and losses on other post-employment benet plans recognized in the Consolidated State-
ments of Income and Expense recognized in Equity for the scal years ended September 30, 2008 and 2007
were as follows:
Other post-employment benets: Assumptions used in the calculation of the DBO and NPBC
Discount rates and other key assumptions used for transition payments in Germany are the same as those uti-
lized for domestic pension benet plans.
The weighted-average assumptions used in calculating the actuarial values for the post-employment healthcare
and life insurance benets are as follows:
Experience adjustments, which result from differences between the actuarial assumptions and the actual occur-
rence, decreased the DBO by 0.9%, 0.3%, 1.5% and 14.2% in scal 2008, 2007, 2006 and 2005, respectively.
Other post-employment benets: Sensitivity analysis
The healthcare assumptions may be signicantly inuenced by the expected progression in healthcare expense.
A one-percentage-point change in the healthcare trend rates would have resulted in the following increase
(decrease) of the dened benet obligation and the service and interest cost as of and for the year ended Sep-
tember 30, 2008:
Year ended September 30, 2008 Year ended September 30, 2007
Total Domestic Foreign Total Domestic Foreign
Actuarial losses (gains) (27) (14) (13) (33) (36) 3
Income tax effect 9 4 5 10 11 (1)
Net amount recognized in the Consolidated
Statements of Income and Expense recognized
in Equity (net of tax) (18) (10) (8) (23) (25) 2
Germany (10) (25)
U.S. (5) 3
Canada (3) (1)
Year ended September 30,
2008 2007
Discount rate 6.70% 6.16%
U.S.:
Medical trend rates (initial/ultimate/year):
Medicare ineligible pre-65 9%/5%/2017 9%/5%/2011
Medicare eligible post-65 9%/5%/2017 9%/5%/2011
Fixed dollar benet – 4.5%
Dental trend rates (initial/ultimate/year) 6%/5%/2021 6%/5%/2021
Canada:
Medical trend rates 5.00% 4.68%
Drug trend rates 7%/5%/2010 4.18%
Dental trend rates 4.00% 4.18%