Sony 1997 Annual Report Download - page 3
Download and view the complete annual report
Please find page 3 of the 1997 Sony annual report below. You can navigate through the pages in the report by either clicking on the pages listed below, or by using the keyword search tool below to find specific information within the annual report.-
 1
1 -
 2
2 -
 3
3 -
 4
4 -
 5
5 -
 6
6 -
 7
7 -
 8
8 -
 9
9 -
 10
10 -
 11
11 -
 12
12 -
 13
13 -
 14
14 -
15
-
16
-
17
-
18
-
19
-
20
-
21
-
22
-
23
-
24
-
25
-
26
-
27
-
28
-
29
-
30
-
31
-
32
-
33
-
34
-
35
-
36
-
37
-
38
-
39
-
40
-
41
-
42
-
43
-
44
-
45
-
46
-
47
-
48
-
49
-
50
-
51
-
52
-
53
-
54
-
55
-
56
-
57
-
58
-
59
-
60
-
61
-
62
-
63
-
64
-
65
 |
 |

1
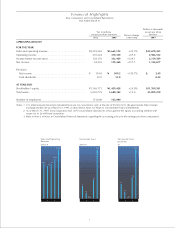
Financial Highlights
Sony Corporation and Consolidated Subsidiaries
Year ended March 31
Dollars in thousands
Yen in millions except per share
except per share amounts amounts
1996 1997 1997
OPERATING RESULTS
FOR THE YEAR
Sales and operating revenue. . . . . . . . . . . . . . . . . . . . . . . . . . ¥4,592,565 ¥5,663,134 +23.3% $45,670,435
Operating income . . . . . . . . . . . . . . . . . . . . . . . . . . . . . . . . . 235,324 370,330 +57.4 2,986,532
Income before income taxes . . . . . . . . . . . . . . . . . . . . . . . . . 138,159 312,429 +126.1 2,519,589
Net income . . . . . . . . . . . . . . . . . . . . . . . . . . . . . . . . . . . . . . 54,252 139,460 +157.1 1,124,677
Per share:
Net income . . . . . . . . . . . . . . . . . . . . . . . . . . . . . . . . . . . . ¥ 134.0 ¥ 309.2 +130.7% $ 2.49
Cash dividends . . . . . . . . . . . . . . . . . . . . . . . . . . . . . . . . . . 50.0 55.0 0.44
AT YEAR-END
Stockholders’ equity . . . . . . . . . . . . . . . . . . . . . . . . . . . . . . . . ¥1,169,173 ¥1,459,428 +24.8% $11,769,581
Total assets . . . . . . . . . . . . . . . . . . . . . . . . . . . . . . . . . . . . . . . 5,045,725 5,680,342 +12.6 45,809,210
Number of employees . . . . . . . . . . . . . . . . . . . . . . . . . . . . . . 151,000 163,000
Notes: 1. U.S. dollar amounts have been translated from yen, for convenience only, at the rate of ¥124=U.S.$1, the approximate Tokyo foreign
exchange market rate as of March 31, 1997, as described in Note 3 of Notes to Consolidated Financial Statements.
2. As of March 31, 1997, Sony Corporation had 1,074 consolidated subsidiaries. It has applied the equity accounting method with
respect to its 26 affiliated companies.
3. Refer to Note 2 of Notes to Consolidated Financial Statements, regarding the accounting policy for the earnings per share computation.
Percent change
1997/1996
Sales and Operating
Revenue
(Billion ¥)
’93 ’94 ’95 ’96 ’97
5,663
4,593
3,991
3,744
4,001
’93 ’94 ’95 ’96 ’97
139
54
(293)
15
36
’93 ’94 ’95 ’96 ’97
309
134
(697)
42
92
Net Income (Loss)
per Share
(¥)
Net Income (Loss)
(Billion ¥)