Sony 1997 Annual Report Download - page 45
Download and view the complete annual report
Please find page 45 of the 1997 Sony annual report below. You can navigate through the pages in the report by either clicking on the pages listed below, or by using the keyword search tool below to find specific information within the annual report.-
 1
1 -
2
-
3
-
4
-
5
-
6
-
7
-
8
-
9
-
10
-
11
-
12
-
13
-
14
-
15
-
16
-
17
-
18
-
19
-
20
-
21
-
22
-
23
-
24
-
25
-
26
-
27
-
28
-
29
-
30
-
31
-
32
-
33
-
34
-
 35
35 -
 36
36 -
 37
37 -
 38
38 -
 39
39 -
 40
40 -
 41
41 -
 42
42 -
 43
43 -
 44
44 -
 45
45 -
 46
46 -
 47
47 -
 48
48 -
 49
49 -
 50
50 -
 51
51 -
 52
52 -
 53
53 -
 54
54 -
 55
55 -
56
-
57
-
58
-
59
-
60
-
61
-
62
-
63
-
64
-
65
 |
 |

43
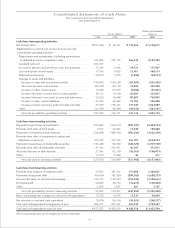
Consolidated Statements of Cash Flows
Sony Corporation and Consolidated Subsidiaries
Year ended March 31
Dollars in thousands
Yen in millions (Note 3)
1995 1996 1997 1997
Cash flows from operating activities:
Net income (loss) . . . . . . . . . . . . . . . . . . . . . . . . . . . . . . . . . . . . ¥(293,356) ¥ 54,252 ¥ 139,460 $ 1,124,677
Adjustments to reconcile net income (loss) to net cash
provided by operating activities—
Depreciation and amortization, including amortization
of deferred insurance acquisition costs . . . . . . . . . . . . . . . . . 226,984 227,316 266,532 2,149,452
Goodwill write-off . . . . . . . . . . . . . . . . . . . . . . . . . . . . . . . . . 265,167 — ——
Accrual for pension and severance costs, less payments . . . . . 15,364 9,604 19,521 157,427
Loss on disposal of fixed assets . . . . . . . . . . . . . . . . . . . . . . . . 17,838 9,429 13,411 108,153
Deferred income taxes . . . . . . . . . . . . . . . . . . . . . . . . . . . . . . (18,935) 5,070 (5,490) (44,274)
Changes in assets and liabilities:
Increase in notes and accounts receivable . . . . . . . . . . . . . (116,093) (150,158) (65,905) (531,492)
(Increase) decrease in inventories . . . . . . . . . . . . . . . . . . . . (86,740) (69,157) 41,825 337,298
Increase in other current assets . . . . . . . . . . . . . . . . . . . . . . (4,385) (32,117) (2,906) (23,435)
Increase (decrease) in notes and accounts payable . . . . . . . 56,112 (4,169) 66,099 533,057
Increase (decrease) in accrued income and other taxes . . . . 10,528 (6,064) 89,887 724,895
Increase in other current liabilities . . . . . . . . . . . . . . . . . . . 57,309 54,438 73,786 595,048
Increase in future insurance policy benefits and other . . . . . 76,100 174,223 131,947 1,064,089
Other . . . . . . . . . . . . . . . . . . . . . . . . . . . . . . . . . . . . . . . . . . . (23,954) (38,490) (45,032) (363,161)
Net cash provided by operating activities . . . . . . . . . . . . . . 181,939 234,177 723,135 5,831,734
Cash flows from investing activities:
Payments for purchases of fixed assets . . . . . . . . . . . . . . . . . . . . (222,861) (250,157) (298,187) (2,404,734)
Proceeds from sales of fixed assets . . . . . . . . . . . . . . . . . . . . . . . 6,637 22,823 14,940 120,484
Payments for investments and advances . . . . . . . . . . . . . . . . . . . (326,684) (490,330) (450,399) (3,632,250)
Proceeds from sales of investment securities and
collections of advances . . . . . . . . . . . . . . . . . . . . . . . . . . . . . . 273,919 313,769 316,787 2,554,734
Payments for purchases of marketable securities . . . . . . . . . . . . (115,244) (54,964) (128,929) (1,039,750)
Proceeds from sales of marketable securities . . . . . . . . . . . . . . . 81,432 101,913 46,105 371,815
(Increase) decrease in time deposits . . . . . . . . . . . . . . . . . . . . . . 27,595 (12,359) (18,361) (148,073)
Other . . . . . . . . . . . . . . . . . . . . . . . . . . . . . . . . . . . . . . . . . . . . . (2,727) (1,694) 46 371
Net cash used in investing activities . . . . . . . . . . . . . . . . . . (277,933) (370,999) (517,998) (4,177,403)
Cash flows from financing activities:
Proceeds from issuance of long-term debt . . . . . . . . . . . . . . . . . 29,853 381,239 171,698 1,384,661
Payments of long-term debt . . . . . . . . . . . . . . . . . . . . . . . . . . . . (69,039) (87,500) (209,383) (1,688,573)
Increase (decrease) in short-term borrowings . . . . . . . . . . . . . . . 153,515 (145,527) (192,034) (1,548,661)
Dividends paid. . . . . . . . . . . . . . . . . . . . . . . . . . . . . . . . . . . . . . (18,681) (18,772) (18,657) (150,460)
Other . . . . . . . . . . . . . . . . . . . . . . . . . . . . . . . . . . . . . . . . . . . . . (2,595) 1,037 881 7,105
Net cash provided by (used in) financing activities . . . . . . . 93,053 130,477 (247,495) (1,995,928)
Effect of exchange rate changes on cash and cash equivalents . . (5,735) (9,871) 11,537 93,040
Net decrease in cash and cash equivalents . . . . . . . . . . . . . . . . (8,676) (16,216) (30,821) (248,557)
Cash and cash equivalents at beginning of year . . . . . . . . . . . . . 484,231 475,555 459,339 3,704,347
Cash and cash equivalents at end of year . . . . . . . . . . . . . . . . . . ¥ 475,555 ¥ 459,339 ¥ 428,518 $ 3,455,790
The accompanying notes are an integral part of these statements.