Sony 1997 Annual Report Download - page 35
Download and view the complete annual report
Please find page 35 of the 1997 Sony annual report below. You can navigate through the pages in the report by either clicking on the pages listed below, or by using the keyword search tool below to find specific information within the annual report.-
 1
1 -
2
-
3
-
4
-
5
-
6
-
7
-
8
-
9
-
10
-
11
-
12
-
13
-
14
-
15
-
16
-
17
-
18
-
19
-
20
-
21
-
22
-
23
-
24
-
 25
25 -
 26
26 -
 27
27 -
 28
28 -
 29
29 -
 30
30 -
 31
31 -
 32
32 -
 33
33 -
 34
34 -
 35
35 -
 36
36 -
 37
37 -
 38
38 -
 39
39 -
 40
40 -
 41
41 -
 42
42 -
 43
43 -
 44
44 -
 45
45 -
46
-
47
-
48
-
49
-
50
-
51
-
52
-
53
-
54
-
55
-
56
-
57
-
58
-
59
-
60
-
61
-
62
-
63
-
64
-
65
 |
 |

33
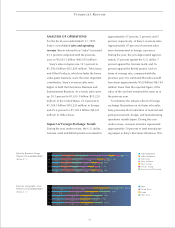
Financial Review
Sales by Geographic Area
(Percent of Consolidated Sales)
(Billion ¥, %)
Sales by Business Group
(Percent of Consolidated Sales)
(Billion ¥, %)
Video Equipment
Audio Equipment
Televisions
Other Products
Music Group
Pictures Group
Insurance and Financing
Japan
United States
Europe
Other Areas
ANALYSIS OF OPERATIONS
For the fiscal year ended March 31, 1997,
Sony’s consolidated sales and operating
revenue (herein referred to as “sales”) increased
23.3 percent compared with the previous
year, to ¥5,663.1 billion ($45,670 million).
Sony’s sales in Japan rose 15.3 percent to
¥1,590.8 billion ($12,829 million). Televisions
and Other Products, which includes the home
video game business, were the most important
contributors. Sony’s overseas sales were
higher in both the Electronics Business and
Entertainment Business. As a result, sales were
up 30.1 percent to ¥1,639.3 billion ($13,220
million) in the United States, 23.8 percent to
¥1,304.5 billion ($10,520 million) in Europe,
and 25.6 percent to ¥1,128.5 billion ($9,101
million) in Other Areas.
Impact of Foreign Exchange Trends
During the year under review, the U.S. dollar,
German mark and British pound accounted for
approximately 67 percent, 5 percent, and 5
percent, respectively, of Sony’s overseas sales.
Approximately 97 percent of overseas sales
were denominated in foreign currencies.
During the year, the yen depreciated approxi-
mately 15 percent against the U.S. dollar, 7
percent against the German mark, and 16
percent against the British pound, each in
terms of average rate, compared with the
previous year. It is estimated that sales would
have been approximately ¥520 billion ($4,194
million) lower than the reported figure, if the
value of the yen had remained the same as in
the previous year.
To minimize the adverse effects of foreign
exchange fluctuations on its financial results,
Sony promotes the localization of material and
parts procurement, design, and manufacturing
operations outside Japan. During the year
under review, overseas activities represented
approximately 50 percent of total manufactur-
ing output in Sony’s Electronics Business. This
’93
’94
’95
’96
’97 5,663
4,593
3,991
3,744
4,001
(14.4) (18.3) (18.3) (26.5) (7.8)(10.3) (4.4)
(15.9) (19.7) (17.3) (24.0) (6.9)(11.2) (5.0)
(17.3) (22.5) (17.8) (19.5) (7.0)(12.4) (3.5)
(17.9) (22.4) (16.5) (19.1) (8.8)(12.3) (3.0)
(20.7) (23.2) (15.8) (16.9) (9.6)(11.2) (2.6)
’93
’94
’95
’96
’97 5,663
4,593
3,991
3,744
4,001
(28.1) (29.0) (23.0) (19.9)
(30.0) (27.4) (23.0) (19.6)
(27.7) (28.9) (22.7) (20.7)
(27.6) (30.8) (22.3) (19.3)
(25.9) (30.4) (26.0) (17.7)