Sony 1997 Annual Report Download - page 51
Download and view the complete annual report
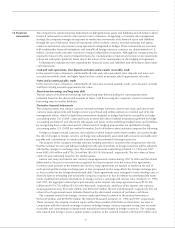
Please find page 51 of the 1997 Sony annual report below. You can navigate through the pages in the report by either clicking on the pages listed below, or by using the keyword search tool below to find specific information within the annual report.-
 1
1 -
2
-
3
-
4
-
5
-
6
-
7
-
8
-
9
-
10
-
11
-
12
-
13
-
14
-
15
-
16
-
17
-
18
-
19
-
20
-
21
-
22
-
23
-
24
-
25
-
26
-
27
-
28
-
29
-
30
-
31
-
32
-
33
-
34
-
35
-
36
-
37
-
38
-
39
-
40
-
 41
41 -
 42
42 -
 43
43 -
 44
44 -
 45
45 -
 46
46 -
 47
47 -
 48
48 -
 49
49 -
 50
50 -
 51
51 -
 52
52 -
 53
53 -
 54
54 -
 55
55 -
 56
56 -
 57
57 -
 58
58 -
 59
59 -
 60
60 -
 61
61 -
62
-
63
-
64
-
65
 |
 |

49
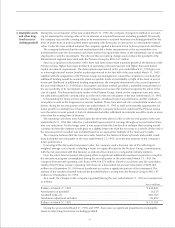
Marketable securities and securities investments and other include debt and equity securities of which the
aggregate fair value, gross unrealized gains and losses and cost pertaining to available-for-sale securities are
as follows: Yen in millions
March 31, 1996 March 31, 1997
Gross Gross Gross Gross
unrealized unrealized Fair unrealized unrealized Fair
Cost gains losses value Cost gains losses value
Available-for-sale:
Debt securities . . . ¥341,554 ¥ 11,592 ¥2,149 ¥350,997
¥531,968 ¥ 22,001 ¥1,338 ¥552,631
Equity securities . . 49,842 158,279 1,006 207,115
49,512 124,682 2,364 171,830
Total . . . . . . . ¥391,396 ¥169,871 ¥3,155 ¥558,112
¥581,480 ¥146,683 ¥3,702 ¥724,461
Dollars in thousands
March 31, 1997
Gross Gross
unrealized unrealized Fair
Cost gains losses value
Available-for-sale:
Debt securities . . . . . . . . . . . . . . . . . . . . . . . . . . . . . . . $4,290,065 $ 177,427 $10,790 $4,456,702
Equity securities . . . . . . . . . . . . . . . . . . . . . . . . . . . . . . 399,290 1,005,500 19,065 1,385,725
Total . . . . . . . . . . . . . . . . . . . . . . . . . . . . . . . . . . . $4,689,355 $1,182,927 $29,855 $5,842,427
At March 31, 1997, debt securities mainly consist of Japanese government and municipal bonds and
corporate debt securities due within 1 to 15 years.
During the years ended March 31, 1995, 1996 and 1997, the net unrealized gains on available-for-sale secu-
rities included in the separate component of stockholders’ equity, net of applicable taxes, decreased by ¥8,028
million, increased by ¥16,361 million and decreased by ¥14,055 million ($113,347 thousand), respectively.
Proceeds from sales of available-for-sale securities on a specifically identified average cost basis were
¥299,727 million, ¥397,774 million and ¥347,790 million ($2,804,758 thousand) for the years ended March
31, 1995, 1996 and 1997, respectively. On those sales, gross realized gains were ¥3,440 million, ¥14,605
million and ¥19,174 million ($154,629 thousand) and gross realized losses were ¥1,863 million, ¥7,734
million and ¥ 9,877 million ($79,653 thousand), respectively.
The net change in unrealized gain or loss on trading securities that has been included in earnings during
the years ended March 31, 1995, 1996 and 1997 was insignificant.
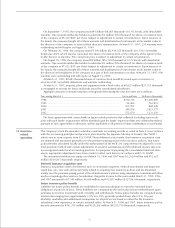
In the ordinary course of business, the company maintains long-term investment securities, included in
securities investments and other, issued by a number of nonpublic companies. The aggregate carrying
amounts of the investments in nonpublic companies were ¥50,146 million and ¥62,346 million ($502,790
thousand) at March 31, 1996 and 1997, respectively. The corresponding fair values at those dates were not
computed as such estimation was not readily determinable.
9. Marketable
securities and
securities
investments
Short-term borrowings at March 31, 1997 comprise the following:
Yen in millions Dollars in thousands
Loans, principally from banks, with interest ranging
from 0.68% to 9.80% per annum . . . . . . . . . . . . . . . . . . . . . . . . . . . . ¥103,851 $837,508
Commercial paper with interest ranging
from 0.65% to 3.10% per annum . . . . . . . . . . . . . . . . . . . . . . . . . . . . 13,950 112,500
¥117,801 $950,008
10. Short-term
borrowings and
long-term debt