Sony 1997 Annual Report Download - page 63
Download and view the complete annual report
Please find page 63 of the 1997 Sony annual report below. You can navigate through the pages in the report by either clicking on the pages listed below, or by using the keyword search tool below to find specific information within the annual report.-
 1
1 -
2
-
3
-
4
-
5
-
6
-
7
-
8
-
9
-
10
-
11
-
12
-
13
-
14
-
15
-
16
-
17
-
18
-
19
-
20
-
21
-
22
-
23
-
24
-
25
-
26
-
27
-
28
-
29
-
30
-
31
-
32
-
33
-
34
-
35
-
36
-
37
-
38
-
39
-
40
-
41
-
42
-
43
-
44
-
45
-
46
-
47
-
48
-
49
-
50
-
51
-
52
-
 53
53 -
 54
54 -
 55
55 -
 56
56 -
 57
57 -
 58
58 -
 59
59 -
 60
60 -
 61
61 -
 62
62 -
 63
63 -
 64
64 -
 65
65
 |
 |

61
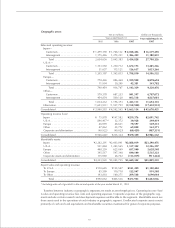
Geographic areas:
Yen in millions Dollars in thousands
Year ended March 31 Year ended March 31,
1995 1996 1997 1997
Sales and operating revenue:
Japan—
Customers . . . . . . . . . . . . . . . . . . . . . . ¥ 1,479,190 ¥ 1,768,132 ¥ 2,048,406 $ 16,519,403
Intersegment . . . . . . . . . . . . . . . . . . . . 1,175,446 1,275,251 1,386,422 11,180,823
Total . . . . . . . . . . . . . . . . . . . . . . . . 2,654,636 3,043,383 3,434,828 27,700,226
U.S.A.—
Customers . . . . . . . . . . . . . . . . . . . . . . 1,153,550 1,250,712 1,672,173 13,485,266
Intersegment . . . . . . . . . . . . . . . . . . . . 51,637 113,121 126,637 1,021,266
Total . . . . . . . . . . . . . . . . . . . . . . . . 1,205,187 1,363,833 1,798,810 14,506,532
Europe—
Customers . . . . . . . . . . . . . . . . . . . . . . 778,465 886,468 1,100,958 8,878,694
Intersegment . . . . . . . . . . . . . . . . . . . . 11,994 30,299 42,381 341,782
Total . . . . . . . . . . . . . . . . . . . . . . . . 790,459 916,767 1,143,339 9,220,476
Other—
Customers . . . . . . . . . . . . . . . . . . . . . . 579,378 687,253 841,597 6,787,072
Intersegment . . . . . . . . . . . . . . . . . . . . 454,854 509,120 603,518 4,867,081
Total . . . . . . . . . . . . . . . . . . . . . . . . 1,034,232 1,196,373 1,445,115 11,654,153
Elimination . . . . . . . . . . . . . . . . . . . . . . . (1,693,931) (1,927,791) (2,158,958) (17,410,952)
Consolidated . . . . . . . . . . . . . . . . . . . . . . . ¥ 3,990,583 ¥ 4,592,565 ¥ 5,663,134 $ 45,670,435
Operating income (loss):
Japan . . . . . . . . . . . . . . . . . . . . . . . . . . . ¥ 75,878 ¥147,582 ¥259,376 $2,091,742
U.S.A.. . . . . . . . . . . . . . . . . . . . . . . . . . . (296,417)* 32,372 30,928 249,419
Europe . . . . . . . . . . . . . . . . . . . . . . . . . . 46,959 48,621 70,597 569,331
Other . . . . . . . . . . . . . . . . . . . . . . . . . . . 47,862 55,772 69,858 563,371
Corporate and elimination . . . . . . . . . . . (40,922) (49,023) (60,429) (487,331)
Consolidated . . . . . . . . . . . . . . . . . . . . . . . ¥(166,640) ¥235,324 ¥370,330 $2,986,532
Identifiable assets:
Japan . . . . . . . . . . . . . . . . . . . . . . . . . . . ¥2,282,291 ¥2,603,041 ¥2,888,019 $23,290,476
U.S.A.. . . . . . . . . . . . . . . . . . . . . . . . . . . 931,884 1,243,565 1,517,302 12,236,307
Europe . . . . . . . . . . . . . . . . . . . . . . . . . . 498,259 623,069 697,940 5,628,548
Other . . . . . . . . . . . . . . . . . . . . . . . . . . . 395,517 547,348 690,100 5,565,323
Corporate assets and elimination . . . . . . 115,969 28,702 (113,019) (911,444)
Consolidated . . . . . . . . . . . . . . . . . . . . . . . ¥4,223,920 ¥5,045,725 ¥5,680,342 $45,809,210
Export sales and operating revenue:
To U.S.A. . . . . . . . . . . . . . . . . . . . . . . . . ¥110,645 ¥125,547 ¥141,420 $1,140,484
To Europe . . . . . . . . . . . . . . . . . . . . . . . . 85,589 110,718 122,947 991,508
To Other . . . . . . . . . . . . . . . . . . . . . . . . . 193,818 169,271 209,568 1,690,064
Total . . . . . . . . . . . . . . . . . . . . . . . . ¥390,052 ¥405,536 ¥473,935 $3,822,056
* Including write-off of goodwill in the second quarter of the year ended March 31, 1995
Transfers between industry or geographic segments are made at arms-length prices. Operating income (loss)
is sales and operating revenue less costs and operating expenses. Corporate expenses of the geographic seg-
ments include certain research and development expenses unallocable to the segments. Identifiable assets are
those assets used in the operations of each industry or geographic segment. Unallocated corporate assets consist
primarily of cash and cash equivalents and marketable securities maintained for general corporate purposes.