Sony 1997 Annual Report Download - page 40
Download and view the complete annual report
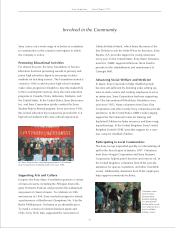
Please find page 40 of the 1997 Sony annual report below. You can navigate through the pages in the report by either clicking on the pages listed below, or by using the keyword search tool below to find specific information within the annual report.-
 1
1 -
2
-
3
-
4
-
5
-
6
-
7
-
8
-
9
-
10
-
11
-
12
-
13
-
14
-
15
-
16
-
17
-
18
-
19
-
20
-
21
-
22
-
23
-
24
-
25
-
26
-
27
-
28
-
29
-
 30
30 -
 31
31 -
 32
32 -
 33
33 -
 34
34 -
 35
35 -
 36
36 -
 37
37 -
 38
38 -
 39
39 -
 40
40 -
 41
41 -
 42
42 -
 43
43 -
 44
44 -
 45
45 -
 46
46 -
 47
47 -
 48
48 -
 49
49 -
 50
50 -
51
-
52
-
53
-
54
-
55
-
56
-
57
-
58
-
59
-
60
-
61
-
62
-
63
-
64
-
65
 |
 |

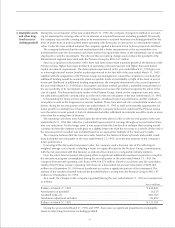
38
Five-Year Summary of Selected Financial Data
Sony Corporation and Consolidated Subsidiaries
Year ended March 31
Dollars in thousands
except per share
Yen in millions except per share amounts amounts
1993 1994 1995 1996 1997 1997
FOR THE YEAR
Sales and operating revenue. . . . . . . . . ¥4,001,270 ¥3,744,285 ¥3,990,583 ¥4,592,565 ¥5,663,134 $45,670,435
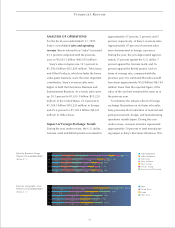
Operating income (loss) . . . . . . . . . . . . 130,640 106,962 (166,640) 235,324 370,330 2,986,532
Income (loss) before income taxes . . . . 92,561 102,162 (220,948) 138,159 312,429 2,519,589
Income taxes . . . . . . . . . . . . . . . . . . . . 49,794 78,612 65,173 77,158 163,570 1,319,113
Net income (loss) . . . . . . . . . . . . . . . . . 36,260 15,298 (293,356) 54,252 139,460 1,124,677
Per share:
Net income (loss) . . . . . . . . . . . . . . . ¥ 92.2 ¥ 42.1 ¥ (696.9) ¥ 134.0 ¥ 309.2 $ 2.49
Cash dividends . . . . . . . . . . . . . . . . . 50.0 50.0 50.0 50.0 55.0 0.44
Depreciation and amortization* . . . . . . ¥ 275,671 ¥ 242,458 ¥ 226,984** ¥ 227,316 ¥ 266,532 $ 2,149,452
Capital expenditures
(additions to fixed assets) . . . . . . . . . . 251,117 195,937 250,678 251,197 298,078 2,403,855
R&D expenses . . . . . . . . . . . . . . . . . . . 232,150 229,877 239,164 257,326 282,569 2,278,782
AT YEAR-END
Net working capital . . . . . . . . . . . . . . . ¥ 367,009 ¥ 616,089 ¥ 537,739 ¥ 816,387 ¥ 843,596 $ 6,803,194
Stockholders’ equity . . . . . . . . . . . . . . . 1,428,219 1,329,565 1,007,808 1,169,173 1,459,428 11,769,581
Stockholders’ equity per share . . . . . . . ¥ 3,827.39 ¥ 3,557.57 ¥ 2,695.31 ¥ 3,125.57 ¥ 3,798.76 $ 30.64
Total assets . . . . . . . . . . . . . . . . . . . . . . ¥4,529,830 ¥4,269,885 ¥4,223,920 ¥5,045,725 ¥5,680,342 $45,809,210
Average number of shares
outstanding during the year
(thousands of shares) . . . . . . . . . . . . . 417,687 417,454 417,665 421,973 458,992
Number of shares issued at
year-end (thousands of shares) . . . . . . 373,158 373,728 373,911 374,068 384,185
** Including amortization of deferred insurance acquisition costs
** Excluding write-off of goodwill
Notes: 1. U.S. dollar amounts have been translated from yen, for convenience only, at the rate of ¥124=U.S.$1, the approximate Tokyo foreign
exchange market rate as of March 31, 1997, as described in Note 3 of Notes to Consolidated Financial Statements.
2. Net income (loss) per share is computed based on the average number of common shares outstanding during each period after
consideration of the dilutive effect of common stock equivalents.
3. During the fiscal year ended March 31, 1996, the Company changed its method of accounting for assessing the carrying values of
intercompany foreign currency commitments to comply with the Emerging Issues Task Force Issue No. 95-2. This did not have a material
impact on results of operations for the years ended March 31, 1996 and 1997.
4. The consolidated results for the fiscal year ended March 31, 1995 reflect the write-off of goodwill of ¥265 billion in the Pictures Group
(refer to Note 4 of Notes to Consolidated Financial Statements) and losses in the Pictures Group of approximately ¥50 billion arising from
a combination of unusual items, such as abandoning a large number of projects in development and providing for settlement of
outstanding lawsuits and contract claims.
5. Refer to Note 2 of Notes to Consolidated Financial Statements, regarding the accounting policy for the earnings per share computation.