Sony 1997 Annual Report Download - page 36
Download and view the complete annual report
Please find page 36 of the 1997 Sony annual report below. You can navigate through the pages in the report by either clicking on the pages listed below, or by using the keyword search tool below to find specific information within the annual report.-
 1
1 -
2
-
3
-
4
-
5
-
6
-
7
-
8
-
9
-
10
-
11
-
12
-
13
-
14
-
15
-
16
-
17
-
18
-
19
-
20
-
21
-
22
-
23
-
24
-
25
-
 26
26 -
 27
27 -
 28
28 -
 29
29 -
 30
30 -
 31
31 -
 32
32 -
 33
33 -
 34
34 -
 35
35 -
 36
36 -
 37
37 -
 38
38 -
 39
39 -
 40
40 -
 41
41 -
 42
42 -
 43
43 -
 44
44 -
 45
45 -
 46
46 -
47
-
48
-
49
-
50
-
51
-
52
-
53
-
54
-
55
-
56
-
57
-
58
-
59
-
60
-
61
-
62
-
63
-
64
-
65
 |
 |

34
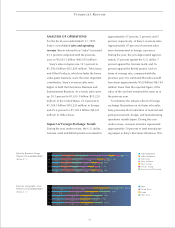
R&D Expenses (Percent
of Consolidated Sales*)
(Billion ¥, %)
Operating Income (Loss)
(Billion ¥)
figure is expected to continue to rise. Sony
employs foreign exchange forward contracts
and foreign currency option contracts to
hedge against foreign exchange risks that arise
from export and import transactions of Sony
Corporation and its subsidiaries. In addition,
interest rate currency swap agreements are
used in connection with certain foreign cur-
rency denominated borrowings and debt.
Cost of sales increased 22.2 percent to
¥3,930.1 billion ($31,694 million), and the
ratio of cost of sales to consolidated sales
improved 1.2 percentage points, to 72.6
percent. Research and development
expenses rose 9.8 percent to ¥282.6 billion
($2,279 million), but as a percentage of
consolidated sales declined 0.7 percentage
point, to 5.2 percent.
Selling, general and administrative expenses
rose 23.4 percent to ¥1,132.2 billion ($9,131
million). These expenses as a percentage of
consolidated sales improved 0.1 percentage
point, to 20.9 percent.
Figures in the above two paragraphs do not include the
revenue and expenses of Insurance and financing.
Insurance and financing expenses were up
3.6 percent to ¥230.5 billion ($1,859 million).
This is mainly attributable to higher future in-
surance policy benefits due to growth in Sony’s
life insurance business. As a percentage of
insurance and financing revenue, these ex-
penses improved 4.8 percentage points, to
91.5 percent.
Operating income grew by 57.4 percent to
¥370.3 billion ($2,987 million), and the ratio
of operating income to consolidated sales
increased 1.4 percentage points, to 6.5 percent.
Other income was up 40.9 percent to
¥92.6 billion ($747 million), while other
expenses decreased 7.6 percent to ¥150.5
billion ($1,214 million). These changes are
primarily attributable to the foreign exchange
gain, net, posted during the year under
review, following a substantial foreign
exchange loss, net, in the previous year.
Foreign exchange gains and losses mainly
arise from the difference between the value of
foreign currency denominated sales and
imports when converted into yen using pre-
vailing exchange rates and the value at settle-
ment of these sales and imports. The rates
used for settlement are primarily based on
foreign exchange forward contracts and
foreign currency option contracts that Sony
employs to hedge risks from exchange rate
fluctuations. During the year under review,
the exchange rates of the yen at settlement of
foreign currency denominated sales were
about the same as prevailing exchange rates.
However, yen exchange rates for settlement of
imports were higher than prevailing rates,
resulting in foreign exchange gains.
Among other income and expenses, the
balance of interest and dividend income less
interest expenses resulted in net interest pay-
ments of ¥51.5 billion ($415 million). This is
¥2.4 billion more than in the previous year,
mainly because of the yen’s depreciation.
’93 ’94 ’95 ’96 ’97
370
235
(167)
107
131
283
(5.2)
257
(5.9)
239
(6.2)
230
(6.3)
232
(6.0)
’93 ’94 ’95 ’96 ’97
*
Excluding Insurance and
financing revenue