Sony 1997 Annual Report Download - page 38
Download and view the complete annual report
Please find page 38 of the 1997 Sony annual report below. You can navigate through the pages in the report by either clicking on the pages listed below, or by using the keyword search tool below to find specific information within the annual report.-
 1
1 -
2
-
3
-
4
-
5
-
6
-
7
-
8
-
9
-
10
-
11
-
12
-
13
-
14
-
15
-
16
-
17
-
18
-
19
-
20
-
21
-
22
-
23
-
24
-
25
-
26
-
27
-
 28
28 -
 29
29 -
 30
30 -
 31
31 -
 32
32 -
 33
33 -
 34
34 -
 35
35 -
 36
36 -
 37
37 -
 38
38 -
 39
39 -
 40
40 -
 41
41 -
 42
42 -
 43
43 -
 44
44 -
 45
45 -
 46
46 -
 47
47 -
 48
48 -
49
-
50
-
51
-
52
-
53
-
54
-
55
-
56
-
57
-
58
-
59
-
60
-
61
-
62
-
63
-
64
-
65
 |
 |
36
Capital Expenditures
Capital expenditures during the year under
review increased 18.7 percent to ¥298.1
billion ($2,404 million). Major components of
this figure are semiconductor-related expen-
ditures of approximately ¥50 billion ($403
million) and capital expenditures in the field
of displays. In the fiscal year ending March
31, 1998, Sony plans to increase semi-
conductor-related capital expenditures for
next-generation products and other require-
ments. The company also plans to expand
manufacturing facilities for lithium-ion
batteries and other products. As a result,
capital expenditures are expected to exceed
the level of the year under review.
FINANCIAL POSITION AND LIQUIDITY
Total assets at the end of the year were
¥5,680.3 billion ($45,809 million), 12.6 per-
cent more than the ¥5,045.7 billion at the
previous year-end. One reason was the sig-
nificantly lower value of the yen in relation to
foreign currencies at the end of the year com-
pared with the previous year-end. An increase
in operating assets of Sony Life Insurance Co.,
Ltd., which recorded higher insurance premi-
ums, also contributed to the rise in assets.
Total short- and long-term borrowings and
debt decreased ¥202.0 billion to ¥1,427.9
billion ($11,515 million). This was the result
of an improvement in Sony’s cash flows and
the conversion of convertible bonds, offset to
some degree by an increase in foreign cur-
rency denominated liabilities caused by the
yen’s depreciation.
Stockholders’ equity grew by ¥290.3 billion
to ¥1,459.4 billion ($11,770 million). The ratio
of stockholders’ equity to total assets increased
by 2.5 percentage points, from 23.2 percent to
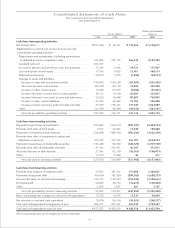
25.7 percent. Based on the number of shares
outstanding at March 31, 1997, stockholders’
equity per share rose to ¥3,798.76 ($30.64)
from ¥3,125.57 at the previous year-end.
Cash Flows
In cash flows from operating activities,
depreciation and amortization rose 17.3
percent to ¥266.5 billion ($2,149 million).
This figure includes the amortization of good-
will and intangibles as well as the amortiza-
tion of deferred insurance acquisition costs.
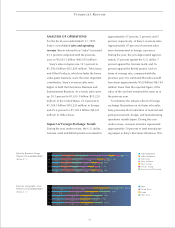
Net cash provided by operating activities grew
to ¥723.1 billion ($5,832 million), up signifi-
cantly from ¥234.2 billion in the previous
year, primarily due to the increase in net
income and the decrease in inventories.
In cash flows from investing activities, net
cash used in investing activities amounted to
¥518.0 billion ($4,177 million), up from
¥371.0 billion in the previous year. This
increase was mainly attributable to growth in
payments for purchases of fixed assets and
marketable securities.
In cash flows from financing activities, net
cash used in financing activities totaled
¥247.5 billion ($1,996 million), mainly due to
a significant decrease in short-term borrowings.
Due to the above factors, and including the
effect of exchange rate changes, there was a net
decrease in cash and cash equivalents of ¥30.8
billion ($249 million), resulting in a balance of
¥428.5 billion ($3,456 million) at year-end.
Net Cash Provided by
Operating Activities
(Billion ¥)
’93 ’94 ’95 ’96 ’97
723
234
182
338
415
Stockholders’ Equity
Per Share
(¥)
’93 ’94 ’95 ’96 ’97
3,799
3,126
2,695
3,558
3,827