Sony 1997 Annual Report Download - page 42
Download and view the complete annual report
Please find page 42 of the 1997 Sony annual report below. You can navigate through the pages in the report by either clicking on the pages listed below, or by using the keyword search tool below to find specific information within the annual report.-
 1
1 -
2
-
3
-
4
-
5
-
6
-
7
-
8
-
9
-
10
-
11
-
12
-
13
-
14
-
15
-
16
-
17
-
18
-
19
-
20
-
21
-
22
-
23
-
24
-
25
-
26
-
27
-
28
-
29
-
30
-
31
-
 32
32 -
 33
33 -
 34
34 -
 35
35 -
 36
36 -
 37
37 -
 38
38 -
 39
39 -
 40
40 -
 41
41 -
 42
42 -
 43
43 -
 44
44 -
 45
45 -
 46
46 -
 47
47 -
 48
48 -
 49
49 -
 50
50 -
 51
51 -
 52
52 -
53
-
54
-
55
-
56
-
57
-
58
-
59
-
60
-
61
-
62
-
63
-
64
-
65
 |
 |
40
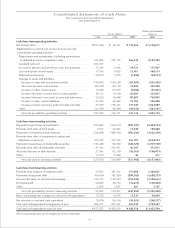
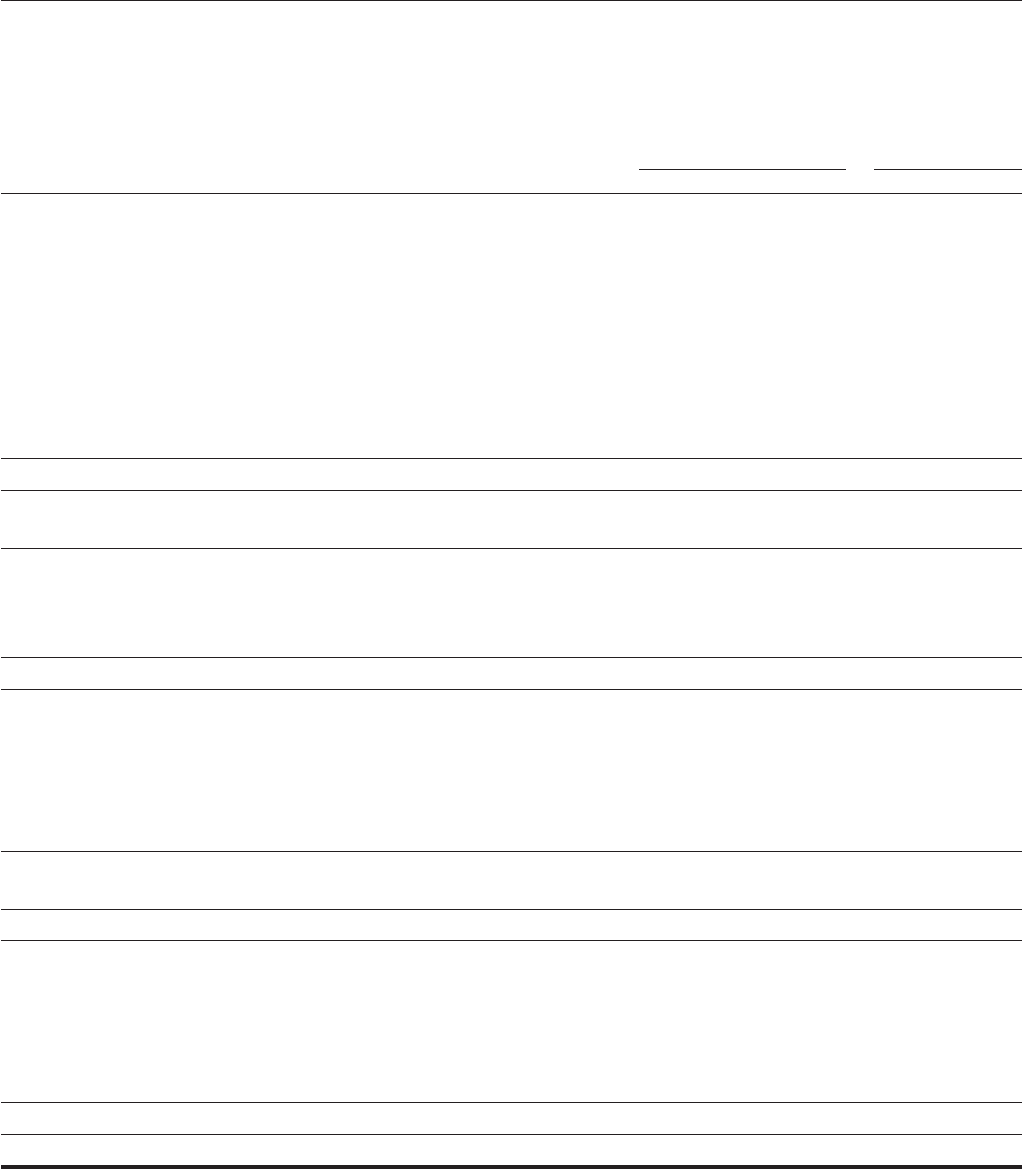
Consolidated Balance Sheets
Sony Corporation and Consolidated Subsidiaries
March 31
Dollars in thousands
Yen in millions (Note 3)
1996 1997 1997
ASSETS
Current assets:
Cash and cash equivalents (Notes 6 and 12) . . . . . . . . . . . . . . . . . . . . . . . . . . ¥ 459,339 ¥ 428,518 $ 3,455,790
Time deposits (Note 12) . . . . . . . . . . . . . . . . . . . . . . . . . . . . . . . . . . . . . . . . . . 32,605 52,518 423,533
Marketable securities (Note 9) . . . . . . . . . . . . . . . . . . . . . . . . . . . . . . . . . . . . . 28,420 120,094 968,500
Notes and accounts receivable, trade (Notes 8 and 12) . . . . . . . . . . . . . . . . . . 923,566 1,066,314 8,599,306
Allowance for doubtful accounts and sales returns . . . . . . . . . . . . . . . . . . . . . . (68,763) (93,732) (755,903)
Inventories (Note 7) . . . . . . . . . . . . . . . . . . . . . . . . . . . . . . . . . . . . . . . . . . . . . 856,638 869,800 7,014,516
Deferred income taxes (Note 14) . . . . . . . . . . . . . . . . . . . . . . . . . . . . . . . . . . . 83,291 111,756 901,258
Prepaid expenses and other current assets . . . . . . . . . . . . . . . . . . . . . . . . . . . . 208,891 240,195 1,937,057
Total current assets . . . . . . . . . . . . . . . . . . . . . . . . . . . . . . . . . . . . . . . . . . 2,523,987 2,795,463 22,544,057
Noncurrent inventories—film (Note 7) . . . . . . . . . . . . . . . . . . . . . . . . . . . . . . 186,007 242,727 1,957,476
Investments and advances:
Affiliated companies . . . . . . . . . . . . . . . . . . . . . . . . . . . . . . . . . . . . . . . . . . . . 40,470 52,547 423,766
Securities investments and other (Note 9) . . . . . . . . . . . . . . . . . . . . . . . . . . . . . 640,182 734,332 5,922,032
680,652 786,879 6,345,798
Property, plant and equipment (Notes 10 and 17):
Land. . . . . . . . . . . . . . . . . . . . . . . . . . . . . . . . . . . . . . . . . . . . . . . . . . . . . . . . . 164,563 179,011 1,443,637
Buildings . . . . . . . . . . . . . . . . . . . . . . . . . . . . . . . . . . . . . . . . . . . . . . . . . . . . . 714,419 818,084 6,597,452
Machinery and equipment . . . . . . . . . . . . . . . . . . . . . . . . . . . . . . . . . . . . . . . . 1,618,612 1,805,851 14,563,314
Construction in progress. . . . . . . . . . . . . . . . . . . . . . . . . . . . . . . . . . . . . . . . . . 78,078 72,661 585,976
2,575,672 2,875,607 23,190,379
Less—Accumulated depreciation . . . . . . . . . . . . . . . . . . . . . . . . . . . . . . . . . . 1,454,913 1,636,696 13,199,161
1,120,759 1,238,911 9,991,218
Other assets:
Intangibles (Notes 4 and 5) . . . . . . . . . . . . . . . . . . . . . . . . . . . . . . . . . . . . . . . 104,733 112,080 903,871
Goodwill (Notes 4 and 5) . . . . . . . . . . . . . . . . . . . . . . . . . . . . . . . . . . . . . . . . . 148,729 161,840 1,305,161
Deferred insurance acquisition costs (Note 11). . . . . . . . . . . . . . . . . . . . . . . . . 112,820 148,032 1,193,806
Other (Note 14) . . . . . . . . . . . . . . . . . . . . . . . . . . . . . . . . . . . . . . . . . . . . . . . . 168,038 194,410 1,567,823
534,320 616,362 4,970,661
¥5,045,725 ¥5,680,342 $45,809,210
The accompanying notes are an integral part of these statements.