Sony 1997 Annual Report Download - page 37
Download and view the complete annual report
Please find page 37 of the 1997 Sony annual report below. You can navigate through the pages in the report by either clicking on the pages listed below, or by using the keyword search tool below to find specific information within the annual report.-
 1
1 -
2
-
3
-
4
-
5
-
6
-
7
-
8
-
9
-
10
-
11
-
12
-
13
-
14
-
15
-
16
-
17
-
18
-
19
-
20
-
21
-
22
-
23
-
24
-
25
-
26
-
 27
27 -
 28
28 -
 29
29 -
 30
30 -
 31
31 -
 32
32 -
 33
33 -
 34
34 -
 35
35 -
 36
36 -
 37
37 -
 38
38 -
 39
39 -
 40
40 -
 41
41 -
 42
42 -
 43
43 -
 44
44 -
 45
45 -
 46
46 -
 47
47 -
48
-
49
-
50
-
51
-
52
-
53
-
54
-
55
-
56
-
57
-
58
-
59
-
60
-
61
-
62
-
63
-
64
-
65
 |
 |

35
Stockholders’ Equity
(Percent of Total Assets)
(Billion ¥, %)
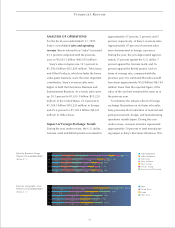
Income before income taxes was up 126.1
percent to ¥312.4 billion ($2,520 million).
Income taxes as a percentage of income
before income taxes declined 3.4 percentage
points, to 52.4 percent.
Net income increased 157.1 percent to
¥139.5 billion ($1,125 million), and repre-
sented 2.5 percent of consolidated sales, up
1.3 percentage points from the previous year.
Net income per share rose from ¥134.0 to
¥309.2 ($2.49) (refer to Note 2 of Notes to
Consolidated Financial Statements). The return
on average stockholders’ equity increased 5.6
percentage points, to 10.6 percent.
Segment Information
The following discussion is based on segment
information (refer to Note 19 of Notes to
Consolidated Financial Statements). The
classification of the sales by geographic area
differs from that of sales described previously
(refer to Note 2 of Composition of Sales and
Operating Revenue by Geographic Area and
Business Group).
By Industry Segment, sales in the Electronics
Business grew 23.6 percent. Backed by the
rise in sales and the yen’s depreciation, oper-
ating income surged 59.2 percent. Operating
income as a percentage of sales in the
Electronics Business improved by 1.6 percent-
age points, to 6.9 percent.
Sales in the Entertainment Business were up
24.0 percent, and operating income climbed
20.8 percent. As a percentage of sales in the
segment, operating income declined by 0.2
percentage point to 6.3 percent. Strong results
outside Japan were behind higher operating
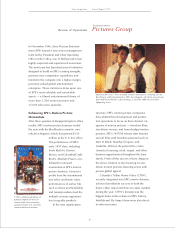
income in the Music Group. The Pictures
Group also posted an increase in operating
income, primarily due to strength in the home
video and television businesses, and to licens-
ing agreements involving Sony Pictures Enter-
tainment’s filmed entertainment library.
In Insurance and financing, the strong
performance of the life insurance business was
mainly responsible for a 9.0 percent rise in
revenue and a large 153.6 percent increase in
operating income.
By Geographic Area, Sony generated higher
sales in all areas. In Japan, sales rose 12.9 per-
cent. Operating income was up by a substantial
75.8 percent, mainly the result of a strong per-
formance in the Electronics Business, including
higher profitability of exports as the yen
weakened. As a percentage of sales in Japan,
operating income rose 2.8 percentage points,
to 7.6 percent. In the United States, sales
increased 31.9 percent, but operating income
declined 4.5 percent and fell 0.7 percentage
point as a percentage of sales. This decline is
primarily due to substantial losses incurred at a
semiconductor manufacturing equipment sub-
sidiary. In Europe, sales increased 24.7 percent
and operating income advanced 45.2 percent,
representing 6.2 percent of sales, 0.9 percent-
age point more than in the previous year. In
Other Areas, sales were up 20.8 percent and
operating income rose 25.3 percent, represent-
ing 4.8 percent of sales, 0.1 percentage point
more than in the previous year.
1,459
(25.7)
1,169
(23.2)
1,008
(23.9)
1,330
(31.1)
1,428
(31.5)
’93 ’94 ’95 ’96 ’97
Capital Expenditures
(Billion ¥)
’93 ’94 ’95 ’96 ’97
298
251251
196
251