Sony 1998 Annual Report Download - page 3
Download and view the complete annual report
Please find page 3 of the 1998 Sony annual report below. You can navigate through the pages in the report by either clicking on the pages listed below, or by using the keyword search tool below to find specific information within the annual report.-
 1
1 -
 2
2 -
 3
3 -
 4
4 -
 5
5 -
 6
6 -
 7
7 -
 8
8 -
 9
9 -
 10
10 -
 11
11 -
 12
12 -
 13
13 -
 14
14 -
15
-
16
-
17
-
18
-
19
-
20
-
21
-
22
-
23
-
24
-
25
-
26
-
27
-
28
-
29
-
30
-
31
-
32
-
33
-
34
-
35
-
36
-
37
-
38
-
39
-
40
-
41
-
42
-
43
-
44
-
45
-
46
-
47
-
48
-
49
-
50
-
51
-
52
-
53
-
54
-
55
-
56
-
57
-
58
-
59
-
60
-
61
-
62
-
63
-
64
-
65
-
66
-
67
-
68
-
69
-
70
-
71
-
72
-
73
-
74
-
75
-
76
-
77
-
78
-
79
-
80
 |
 |

Annual Report 1998 Sony Corporation [1]
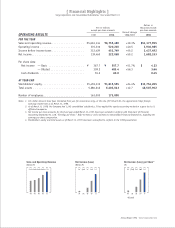
Sales and Operating Revenue
(Billion ¥)
Net Income (Loss) per Share*
(¥)
Net Income (Loss)
(Billion ¥)
94
3,744
95 96 97 98
3,991 4,593 5,663 6,755
94
41
95 96 97 98
(785) 134 309 483
94
15
95 96 97 98
(293) 54 139 222
[ Financial Highlights ]
Sony Corporation and Consolidated Subsidiaries •Year ended March 31
Dollars in
Yen in millions thousands except
except per share amounts per share amounts
OPERATING RESULTS 1997 1998 1998
FOR THE YEAR
Sales and operating revenue . . . . . . . . . . . . . . . . . . . ¥5,663,134 ¥6,755,490 +19.3% $51,177,955
Operating income . . . . . . . . . . . . . . . . . . . . . . . . . . 370,330 520,210 +40.5 3,940,985
Income before income taxes . . . . . . . . . . . . . . . . . . . 312,429 453,749 +45.2 3,437,492
Net income. . . . . . . . . . . . . . . . . . . . . . . . . . . . . . . 139,460 222,068 +59.2 1,682,333
Per share data:
Net income — Basic . . . . . . . . . . . . . . . . . . . . . ¥ 367.7 ¥ 557.7 +51.7% $ 4.23
— Diluted . . . . . . . . . . . . . . . . . . . . 309.2 483.4 +56.3 3.66
Cash dividends . . . . . . . . . . . . . . . . . . . . . . . . . . 55.0 60.0 0.45
AT YEAR-END
Stockholders’ equity. . . . . . . . . . . . . . . . . . . . . . . . . ¥1,459,332 ¥1,815,555 +24.4% $13,754,205
Total assets . . . . . . . . . . . . . . . . . . . . . . . . . . . . . . 5,680,246 6,403,043 +12.7 48,507,902
Number of employees. . . . . . . . . . . . . . . . . . . . . . . . 163,000 173,000
Notes: 1. U.S. dollar amounts have been translated from yen, for convenience only, at the rate of ¥132=U.S.$1, the approximate Tokyo foreign
exchange market rate as of March 31, 1998.
2. As of March 31, 1998, the Company had 1,142 consolidated subsidiaries. It has applied the equity accounting method in respect to its 61
affiliated companies.
3. Net income per share amounts for the fiscal year ended March 31, 1997 have been restated to conform with Statement of Financial
Accounting Standards No. 128, “Earnings per Share.” Refer to Notes 2 and 4 of Notes to Consolidated Financial Statements, regarding the
earnings per share computation.
4. Stockholders’ equity and total assets as of March 31, 1997 have been reclassified to conform to the 1998 presentation.
Percent change
1998/1997
*Diluted