Sony 1998 Annual Report Download - page 49
Download and view the complete annual report
Please find page 49 of the 1998 Sony annual report below. You can navigate through the pages in the report by either clicking on the pages listed below, or by using the keyword search tool below to find specific information within the annual report.-
 1
1 -
2
-
3
-
4
-
5
-
6
-
7
-
8
-
9
-
10
-
11
-
12
-
13
-
14
-
15
-
16
-
17
-
18
-
19
-
20
-
21
-
22
-
23
-
24
-
25
-
26
-
27
-
28
-
29
-
30
-
31
-
32
-
33
-
34
-
35
-
36
-
37
-
38
-
 39
39 -
 40
40 -
 41
41 -
 42
42 -
 43
43 -
 44
44 -
 45
45 -
 46
46 -
 47
47 -
 48
48 -
 49
49 -
 50
50 -
 51
51 -
 52
52 -
 53
53 -
 54
54 -
 55
55 -
 56
56 -
 57
57 -
 58
58 -
 59
59 -
60
-
61
-
62
-
63
-
64
-
65
-
66
-
67
-
68
-
69
-
70
-
71
-
72
-
73
-
74
-
75
-
76
-
77
-
78
-
79
-
80
 |
 |

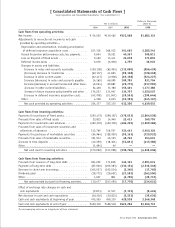
Annual Report 1998 Sony Corporation [47]
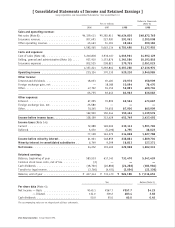
[ Quarterly Financial and Stock Information ]
Sony Corporation and Consolidated Subsidiaries
(Unaudited)
Year ended March 31
Dollars in millions
except per share
Yen in billions except per share amounts amounts
1st Quarter 2nd Quarter 3rd Quarter 4th Quarter 4th Quarter
1997 1998 1997 1998 1997 1998 1997 1998 1998
Sales and operating
revenue . . . . . . . . . . . . . ¥1,172.2 ¥1,430.3 ¥1,358.5 ¥1,638.5 ¥1,666.8 ¥2,012.7 ¥1,465.7 ¥ 1,674.0 $12,681.6
Operating income . . . . . . . 55.3 97.3 80.6 140.4 164.5 223.7 69.9 58.9 446.2
Interest income
(expense), net . . . . . . . . . (12.6) (9.8) (13.5) (10.5) (13.9) (11.6) (11.5) (9.6) (72.4)
Foreign exchange gain
(loss), net . . . . . . . . . . . (0.6) 6.4 7.6 (6.8) 5.8 6.8 5.3 3.6 27.6
Income before
income taxes . . . . . . . . . . 43.8 91.9 65.7 110.2 147.4 214.3 55.6 37.4 283.3
Income taxes . . . . . . . . . . 25.9 54.6 28.0 48.6 67.8 96.9 41.8 14.8 111.8
Net income . . . . . . . . . . . . 17.1 34.8 34.6 56.1 75.4 110.4 12.3 20.8 157.3
Net income per share
Basic . . . . . . . . . . . . . . ¥ 45.7 ¥ 89.8 ¥ 92.6 ¥ 141.7 ¥ 201.2 ¥ 274.4 ¥ 32.5 ¥ 51.0 $ 0.39
Diluted . . . . . . . . . . . . . 38.2 76.3 76.1 122.1 163.8 239.0 27.9 45.9 0.35
Depreciation and
amortization* . . . . . . . . . ¥ 59.7 ¥ 65.6 ¥ 61.8 ¥ 72.9 ¥ 66.9 ¥ 78.3 ¥ 78.2 ¥ 84.8 $ 642.2
Capital expenditures
(additions to fixed assets) . 67.5 79.0 76.6 88.8 57.3 83.3 96.7 136.9 1,037.2
R&D expenses . . . . . . . . . . 62.8 69.7 74.6 80.5 67.1 79.6 78.0 88.2 668.2
Tokyo Stock Exchange
price per share of
Common Stock:
High . . . . . . . . . . . . . . ¥ 7,310 ¥ 10,100 ¥ 7,260 ¥ 12,600 ¥ 7,700 ¥ 12,200 ¥ 9,180 ¥ 12,700 $ 96.2
Low . . . . . . . . . . . . . . . 6,350 8,520 6,680 9,550 6,720 9,320 7,250 10,400 78.8
New York Stock Exchange
price per American
Depositary Share:
High . . . . . . . . . . . . . . $ 66 5/8$ 88 7/8$ 66
1/4$103 11/16 $ 67 7
/8$98
7
/16 $ 74 1/4$ 97
3/16
Low . . . . . . . . . . . . . . . 59 5/869 1/261 1/285 1/16 58 7/8741/2163 3/882 5/16
* Including amortization of deferred insurance acquisition costs
Notes: 1. U.S. dollar amounts have been translated from yen, for convenience only, at the rate of ¥132=U.S.$1, the approximate Tokyo foreign exchange
market rate as of March 31, 1998, as described in Note 3 of Notes to Consolidated Financial Statements.
2. Net income per share amounts were computed based on Statement of Financial Accounting Standards No. 128, “Earnings per Share” (FAS 128).
All prior-period net income per share amounts have been restated to conform with FAS 128. FAS 128 requires presentation of basic and diluted
net income per share on the face of the income statement. Under FAS 128, basic net income per share is computed based on the average
number of shares of common stock outstanding during each period and diluted net income per share assumes the dilution that could occur if
securities or other contracts to issue common stock were exercised or converted into common stock or resulted in the issuance of common stock.
Refer to Note 4 of Notes to Consolidated Financial Statements.