Sony 1998 Annual Report Download - page 54
Download and view the complete annual report
Please find page 54 of the 1998 Sony annual report below. You can navigate through the pages in the report by either clicking on the pages listed below, or by using the keyword search tool below to find specific information within the annual report.-
 1
1 -
2
-
3
-
4
-
5
-
6
-
7
-
8
-
9
-
10
-
11
-
12
-
13
-
14
-
15
-
16
-
17
-
18
-
19
-
20
-
21
-
22
-
23
-
24
-
25
-
26
-
27
-
28
-
29
-
30
-
31
-
32
-
33
-
34
-
35
-
36
-
37
-
38
-
39
-
40
-
41
-
42
-
43
-
 44
44 -
 45
45 -
 46
46 -
 47
47 -
 48
48 -
 49
49 -
 50
50 -
 51
51 -
 52
52 -
 53
53 -
 54
54 -
 55
55 -
 56
56 -
 57
57 -
 58
58 -
 59
59 -
 60
60 -
 61
61 -
 62
62 -
 63
63 -
 64
64 -
65
-
66
-
67
-
68
-
69
-
70
-
71
-
72
-
73
-
74
-
75
-
76
-
77
-
78
-
79
-
80
 |
 |

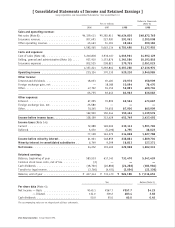
[52] Sony Corporation Annual Report 1998
Dollars in thousands
Yen in millions (Note 3)
1996 1997 1998 1998
Sales and operating revenue:
Net sales (Note 8) . . . . . . . . . . . . . . . . . . . . . . . ¥4,339,411 ¥5,383,911 ¥6,424,805 $48,672,765
Insurance revenue . . . . . . . . . . . . . . . . . . . . . . . 207,691 227,920 291,061 2,205,008
Other operating revenue. . . . . . . . . . . . . . . . . . . 45,463 51,303 39,624 300,182
4,592,565 5,663,134 6,755,490 51,177,955
Costs and expenses:
Cost of sales (Note 16). . . . . . . . . . . . . . . . . . . . 3,216,806 3,930,107 4,618,961 34,992,129
Selling, general and administrative (Note 16) . . . . 937,910 1,153,876 1,345,584 10,193,818
Insurance expenses . . . . . . . . . . . . . . . . . . . . . . 202,525 208,821 270,735 2,051,023
4,357,241 5,292,804 6,235,280 47,236,970
Operating income . . . . . . . . . . . . . . . . . . . . . . 235,324 370,330 520,210 3,940,985
Other income:
Interest and dividends . . . . . . . . . . . . . . . . . . . . 18,053 19,406 20,976 158,909
Foreign exchange gain, net . . . . . . . . . . . . . . . . — 18,085 10,094 76,470
Other. . . . . . . . . . . . . . . . . . . . . . . . . . . . . . . . 47,702 55,152 52,893 400,704
65,755 92,643 83,963 636,083
Other expenses:
Interest . . . . . . . . . . . . . . . . . . . . . . . . . . . . . . 67,095 70,892 62,524 473,667
Foreign exchange loss, net . . . . . . . . . . . . . . . . . 25,580 — ——
Other. . . . . . . . . . . . . . . . . . . . . . . . . . . . . . . . 70,245 79,652 87,900 665,909
162,920 150,544 150,424 1,139,576
Income before income taxes . . . . . . . . . . . . . . . 138,159 312,429 453,749 3,437,492
Income taxes (Note 14):
Current . . . . . . . . . . . . . . . . . . . . . . . . . . . . . . 72,088 169,060 210,113 1,591,765
Deferred. . . . . . . . . . . . . . . . . . . . . . . . . . . . . . 5,070 (5,490) 4,755 36,023
77,158 163,570 214,868 1,627,788
Income before minority interest . . . . . . . . . . . . 61,001 148,859 238,881 1,809,704
Minority interest in consolidated subsidiaries . . 6,749 9,399 16,813 127,371
Net income . . . . . . . . . . . . . . . . . . . . . . . . . . . 54,252 139,460 222,068 1,682,333
Retained earnings:
Balance, beginning of year . . . . . . . . . . . . . . . . . 585,553 617,343 731,470 5,541,439
Common stock issue costs, net of tax . . . . . . . . . . (2) — ——
Cash dividends . . . . . . . . . . . . . . . . . . . . . . . . . (18,700) (20,882) (24,286) (183,984)
Transfer to legal reserve . . . . . . . . . . . . . . . . . . . (3,760) (4,451) (3,054) (23,136)
Balance, end of year . . . . . . . . . . . . . . . . . . . . . ¥ 617,343 ¥ 731,470 ¥ 926,198 $ 7,016,652
Yen Dollars (Note 3)
Per share data (Note 4):
Net income — Basic . . . . . . . . . . . . . . . . . . . . . ¥145.1 ¥367.7 ¥557.7 $4.23
— Diluted . . . . . . . . . . . . . . . . . . . . 134.0 309.2 483.4 3.66
Cash dividends . . . . . . . . . . . . . . . . . . . . . . . . . 50.0 55.0 60.0 0.45
The accompanying notes are an integral part of these statements.
[ Consolidated Statements of Income and Retained Earnings ]
Sony Corporation and Consolidated Subsidiaries •Year ended March 31