Sony 1998 Annual Report Download - page 43
Download and view the complete annual report
Please find page 43 of the 1998 Sony annual report below. You can navigate through the pages in the report by either clicking on the pages listed below, or by using the keyword search tool below to find specific information within the annual report.-
 1
1 -
2
-
3
-
4
-
5
-
6
-
7
-
8
-
9
-
10
-
11
-
12
-
13
-
14
-
15
-
16
-
17
-
18
-
19
-
20
-
21
-
22
-
23
-
24
-
25
-
26
-
27
-
28
-
29
-
30
-
31
-
32
-
 33
33 -
 34
34 -
 35
35 -
 36
36 -
 37
37 -
 38
38 -
 39
39 -
 40
40 -
 41
41 -
 42
42 -
 43
43 -
 44
44 -
 45
45 -
 46
46 -
 47
47 -
 48
48 -
 49
49 -
 50
50 -
 51
51 -
 52
52 -
 53
53 -
54
-
55
-
56
-
57
-
58
-
59
-
60
-
61
-
62
-
63
-
64
-
65
-
66
-
67
-
68
-
69
-
70
-
71
-
72
-
73
-
74
-
75
-
76
-
77
-
78
-
79
-
80
 |
 |

Annual Report 1998 Sony Corporation [41]
decrease in the foreign exchange gain, net, compared with the previous fiscal year. Foreign exchange gains and losses
mainly arise from the difference between the value of foreign currency denominated exports and imports when
converted into various currencies using prevailing exchange rates and the value at settlement of these exports and
imports. The rates used for settlement are primarily based on foreign exchange forward contracts and foreign currency
option contracts that Sony employs to hedge risks from exchange rate fluctuations. Among other income and ex-
penses, interest and dividends increased, mainly because of an increase in cash and time deposits and higher invest-
ment returns at overseas subsidiaries. Interest expense decreased, mainly due to lower outstanding debt at overseas
subsidiaries. As a result, the balance of interest and dividend income less interest expense improved by ¥9.9 billion
to net interest expense of ¥41.5 billion ($315 million).
Income Before Income Taxes
Income before income taxes during the year rose 45.2% to ¥453.7 billion ($3,437 million).
Income Taxes
Income taxes as a percentage of income before income taxes (the effective tax rate) declined 5.0 percentage points,
to 47.4%. This decline is mainly attributable to improved performance at overseas subsidiaries which incurred oper-
ating losses in the previous fiscal year. Due to the reduction of the Japanese statutory income tax rate, effective April
1, 1998, the new statutory tax rate has been used in calculating the future expected tax effects of temporary
differences. The effect of the enacted change in tax rate, which resulted in a reduction of income tax expenses, was
insignificant (refer to Note 14 of Notes to Consolidated Financial Statements).
Net Income
Net income increased 59.2% to ¥222.1 billion ($1,682 million). Basic net income per share rose from ¥367.7 to
¥557.7 ($4.23) and diluted net income per share rose from ¥309.2 to ¥483.4 ($3.66).
Net income represented 3.3% of sales, up 0.8 percentage point, and the return on average stockholders’ equity
increased 3.0 percentage points, to 13.6%.
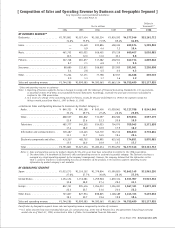
Results by Business Segment
The following discussion is based on segment information (refer to Note 19 of Notes to Consolidated Financial
Statements).
Business Segment Information
Year ended March 31
Sales and operating revenue percent change
(Yen in billions) 1997 1998 1998/1997
Electronics . . . . . . . . . . . . . . . . . . . . . . . . . . . . . . . . . . . . . . . . . . . . . . . . . ¥4,132 ¥4,690 +13.5%
Game . . . . . . . . . . . . . . . . . . . . . . . . . . . . . . . . . . . . . . . . . . . . . . . . . . . . . 419 722 +72.3
Music . . . . . . . . . . . . . . . . . . . . . . . . . . . . . . . . . . . . . . . . . . . . . . . . . . . . . 592 695 +17.3
Pictures . . . . . . . . . . . . . . . . . . . . . . . . . . . . . . . . . . . . . . . . . . . . . . . . . . . 439 643 +46.7
Insurance . . . . . . . . . . . . . . . . . . . . . . . . . . . . . . . . . . . . . . . . . . . . . . . . . . 228 291 +27.7
Other . . . . . . . . . . . . . . . . . . . . . . . . . . . . . . . . . . . . . . . . . . . . . . . . . . . . . 240 248 +3.3
Elimination . . . . . . . . . . . . . . . . . . . . . . . . . . . . . . . . . . . . . . . . . . . . . . . . . (387) (534) –
Consolidated . . . . . . . . . . . . . . . . . . . . . . . . . . . . . . . . . . . . . . . . . . . . . . . . ¥5,663 ¥6,755 +19.3%
Operating income (loss) percent change
(Yen in billions) 1997 1998 1998/1997
Electronics . . . . . . . . . . . . . . . . . . . . . . . . . . . . . . . . . . . . . . . . . . . . . . . . . ¥ 239 ¥ 314 +31.4%
Game . . . . . . . . . . . . . . . . . . . . . . . . . . . . . . . . . . . . . . . . . . . . . . . . . . . . . 57 117 +105.0
Music . . . . . . . . . . . . . . . . . . . . . . . . . . . . . . . . . . . . . . . . . . . . . . . . . . . . . 45 54 +19.6
Pictures . . . . . . . . . . . . . . . . . . . . . . . . . . . . . . . . . . . . . . . . . . . . . . . . . . . 29 36 +22.9
Insurance . . . . . . . . . . . . . . . . . . . . . . . . . . . . . . . . . . . . . . . . . . . . . . . . . . 19 20 +6.4
Other . . . . . . . . . . . . . . . . . . . . . . . . . . . . . . . . . . . . . . . . . . . . . . . . . . . . . (1) (10) –
Corporate and elimination . . . . . . . . . . . . . . . . . . . . . . . . . . . . . . . . . . . . . . . (18) (11) –
Consolidated . . . . . . . . . . . . . . . . . . . . . . . . . . . . . . . . . . . . . . . . . . . . . . . . ¥ 370 ¥ 520 +40.5%