Sony 1998 Annual Report Download - page 61
Download and view the complete annual report
Please find page 61 of the 1998 Sony annual report below. You can navigate through the pages in the report by either clicking on the pages listed below, or by using the keyword search tool below to find specific information within the annual report.-
 1
1 -
2
-
3
-
4
-
5
-
6
-
7
-
8
-
9
-
10
-
11
-
12
-
13
-
14
-
15
-
16
-
17
-
18
-
19
-
20
-
21
-
22
-
23
-
24
-
25
-
26
-
27
-
28
-
29
-
30
-
31
-
32
-
33
-
34
-
35
-
36
-
37
-
38
-
39
-
40
-
41
-
42
-
43
-
44
-
45
-
46
-
47
-
48
-
49
-
50
-
 51
51 -
 52
52 -
 53
53 -
 54
54 -
 55
55 -
 56
56 -
 57
57 -
 58
58 -
 59
59 -
 60
60 -
 61
61 -
 62
62 -
 63
63 -
 64
64 -
 65
65 -
 66
66 -
 67
67 -
 68
68 -
 69
69 -
 70
70 -
 71
71 -
72
-
73
-
74
-
75
-
76
-
77
-
78
-
79
-
80
 |
 |

Annual Report 1998 Sony Corporation [59]
9. Marketable securities and securities investments
Marketable securities and securities investments and other include debt and equity securities of which the aggregate
fair value, gross unrealized gains and losses and cost pertaining to available-for-sale securities are as follows:
Yen in millions
March 31, 1997 March 31, 1998
Gross Gross Gross Gross
unrealized unrealized unrealized unrealized
Cost gains losses Fair value Cost gains losses Fair value
Available-for-sale:
Debt securities . . ¥531,968 ¥ 22,001 ¥1,338 ¥552,631 ¥613,905 ¥27,146 ¥2,135 ¥638,916
Equity securities . . 49,512 124,682 2,364 171,830 60,049 65,486 4,220 121,315
Total. . . . . . . . ¥581,480 ¥146,683 ¥3,702 ¥724,461 ¥673,954 ¥92,632 ¥6,355 ¥760,231
Dollars in thousands
March 31, 1998
Gross Gross
unrealized unrealized
Cost gains losses Fair value
Available-for-sale:
Debt securities . . . . . . . . . . . . . . . . . . . . . . . . . . . . . . $4,650,795 $205,652 $16,174 $4,840,273
Equity securities . . . . . . . . . . . . . . . . . . . . . . . . . . . . . 454,917 496,106 31,970 919,053
Total. . . . . . . . . . . . . . . . . . . . . . . . . . . . . . . . . . . . $5,105,712 $701,758 $48,144 $5,759,326
Marketable securities and securities investments and other as of March 31, 1997 and 1998 include short-term
investments in money market funds and long-term advances to third parties of ¥65,776 million and ¥131,662 million
($997,439 thousand), respectively.
At March 31, 1998, debt securities mainly consist of Japanese government and municipal bonds and corporate
debt securities due within 1 to 15 years.
During the years ended March 31, 1996, 1997 and 1998, the net unrealized gains on available-for-sale securities
included in the separate component of stockholders’ equity, net of applicable taxes, increased by ¥16,361 million,
decreased by ¥14,055 million and decreased by ¥22,105 million ($167,462 thousand), respectively.
Proceeds from sales of available-for-sale securities were ¥397,774 million, ¥347,790 million and ¥359,815 million
($2,725,871 thousand) for the years ended March 31, 1996, 1997 and 1998, respectively. On those sales, gross real-
ized gains computed on the average cost basis were ¥14,605 million, ¥19,174 million and ¥18,028 million ($136,576
thousand) and gross realized losses were ¥7,734 million, ¥9,877 million and ¥13,793 million ($104,492 thousand),
respectively.
The net change in unrealized gain or loss on trading securities that has been included in earnings during the
years ended March 31, 1996, 1997 and 1998 was insignificant.
In the ordinary course of business, the company maintains long-term investment securities, included in securities
investments and other, issued by a number of nonpublic companies. The aggregate carrying amounts of the invest-
ments in nonpublic companies were ¥62,346 million and ¥60,527 million ($458,538 thousand) at March 31, 1997
and 1998, respectively. The corresponding fair values at those dates were not computed as such estimation was not
readily determinable.
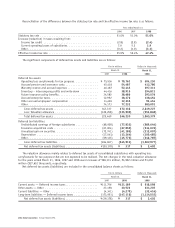
10. Short-term borrowings and long-term debt
Short-term borrowings at March 31, 1998 comprise the following:
Yen in millions Dollars in thousands
Loans, principally from banks, with interest ranging
from 0.77% to 12.00% per annum . . . . . . . . . . . . . . . . . . . . . . . . . . . . . . ¥112,636 $853,303
Commercial paper with interest of 6.15% per annum . . . . . . . . . . . . . . . . . . 1,981 15,008
¥114,617 $868,311