Sony 1998 Annual Report Download - page 68
Download and view the complete annual report
Please find page 68 of the 1998 Sony annual report below. You can navigate through the pages in the report by either clicking on the pages listed below, or by using the keyword search tool below to find specific information within the annual report.-
 1
1 -
2
-
3
-
4
-
5
-
6
-
7
-
8
-
9
-
10
-
11
-
12
-
13
-
14
-
15
-
16
-
17
-
18
-
19
-
20
-
21
-
22
-
23
-
24
-
25
-
26
-
27
-
28
-
29
-
30
-
31
-
32
-
33
-
34
-
35
-
36
-
37
-
38
-
39
-
40
-
41
-
42
-
43
-
44
-
45
-
46
-
47
-
48
-
49
-
50
-
51
-
52
-
53
-
54
-
55
-
56
-
57
-
 58
58 -
 59
59 -
 60
60 -
 61
61 -
 62
62 -
 63
63 -
 64
64 -
 65
65 -
 66
66 -
 67
67 -
 68
68 -
 69
69 -
 70
70 -
 71
71 -
 72
72 -
 73
73 -
 74
74 -
 75
75 -
 76
76 -
 77
77 -
 78
78 -
79
-
80
 |
 |

[66] Sony Corporation Annual Report 1998
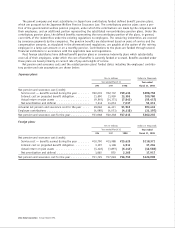
Reconciliation of the differences between the statutory tax rate and the effective income tax rate is as follows:
Year ended March 31
1996 1997 1998
Statutory tax rate . . . . . . . . . . . . . . . . . . . . . . . . . . . . . . . . . . . . . . . . . . 51.0% 51.0% 51.0%
Increase (reduction) in taxes resulting from:
Income tax credit . . . . . . . . . . . . . . . . . . . . . . . . . . . . . . . . . . . . . . . . (2.8) (2.8) (2.4)
Current operating losses of subsidiaries. . . . . . . . . . . . . . . . . . . . . . . . . . 7.9 5.2 1.9
Other . . . . . . . . . . . . . . . . . . . . . . . . . . . . . . . . . . . . . . . . . . . . . . . . . (0.2) (1.0) (3.1)
Effective income tax rate . . . . . . . . . . . . . . . . . . . . . . . . . . . . . . . . . . . . . 55.9% 52.4% 47.4%
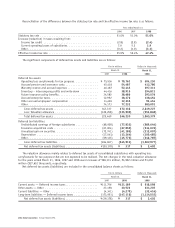
The significant components of deferred tax assets and liabilities are as follows:
Yen in millions Dollars in thousands
March 31 March 31,
1997 1998 1998
Deferred tax assets:
Operating loss carryforwards for tax purposes. . . . . . . . . . . . . . ¥ 75,536 ¥ 79,761 $ 604,250
Accrued pension and severance costs . . . . . . . . . . . . . . . . . . . 45,418 54,487 412,780
Warranty reserve and accrued expenses . . . . . . . . . . . . . . . . . . 46,187 52,445 397,311
Inventory – intercompany profits and write-down . . . . . . . . . . 44,416 38,915 294,811
Future insurance policy benefits. . . . . . . . . . . . . . . . . . . . . . . 34,580 38,686 293,076
Accrued enterprise taxes . . . . . . . . . . . . . . . . . . . . . . . . . . . . 12,952 18,276 138,454
Other accrued employees’ compensation . . . . . . . . . . . . . . . . . 14,465 12,336 93,454
Other . . . . . . . . . . . . . . . . . . . . . . . . . . . . . . . . . . . . . . . . . 74,173 77,232 585,091
Gross deferred tax assets . . . . . . . . . . . . . . . . . . . . . . . . . . 347,727 372,138 2,819,227
Less: Valuation allowance . . . . . . . . . . . . . . . . . . . . . . . . . (122,258) (125,908) (953,848)
Total deferred tax assets . . . . . . . . . . . . . . . . . . . . . . . . . . 225,469 246,230 1,865,379
Deferred tax liabilities:
Undistributed earnings of foreign subsidiaries . . . . . . . . . . . . . (68,928) (77,833) (589,644)
Insurance acquisition costs . . . . . . . . . . . . . . . . . . . . . . . . . . (67,004) (67,858) (514,076)
Unrealized gain on securities. . . . . . . . . . . . . . . . . . . . . . . . . (72,741) (41,185) (312,007)
Depreciation . . . . . . . . . . . . . . . . . . . . . . . . . . . . . . . . . . . . (17,041) (13,264) (100,485)
Other . . . . . . . . . . . . . . . . . . . . . . . . . . . . . . . . . . . . . . . . . (39,133) (45,773) (346,765)
Gross deferred tax liabilities. . . . . . . . . . . . . . . . . . . . . . . . (264,847) (245,913) (1,862,977)
Net deferred tax assets (liabilities) . . . . . . . . . . . . . . . . . . . ¥(39,378) ¥ 317 $ 2,402
The valuation allowance mainly relates to deferred tax assets of consolidated subsidiaries with operating loss
carryforwards for tax purposes that are not expected to be realized. The net changes in the total valuation allowance
for the years ended March 31, 1996, 1997 and 1998 were increases of ¥28,174 million, ¥3,902 million and ¥3,650
million ($27,652 thousand), respectively.
Net deferred tax assets (liabilities) are included in the consolidated balance sheets as follows:
Yen in millions Dollars in thousands
March 31 March 31,
1997 1998 1998
Current assets — Deferred income taxes . . . . . . . . . . . . . . . . . . . ¥111,756 ¥121,189 $ 918,098
Other assets — Other . . . . . . . . . . . . . . . . . . . . . . . . . . . . . . . 27,158 30,523 231,235
Current liabilities — Other . . . . . . . . . . . . . . . . . . . . . . . . . . . . (4,341) (4,279) (32,416)
Long-term liabilities — Deferred income taxes . . . . . . . . . . . . . . (173,951) (147,116) (1,114,515)
Net deferred tax assets (liabilities) . . . . . . . . . . . . . . . . . . . ¥ (39,378) ¥ 317 $ 2,402