Sony 1998 Annual Report Download - page 42
Download and view the complete annual report
Please find page 42 of the 1998 Sony annual report below. You can navigate through the pages in the report by either clicking on the pages listed below, or by using the keyword search tool below to find specific information within the annual report.-
 1
1 -
2
-
3
-
4
-
5
-
6
-
7
-
8
-
9
-
10
-
11
-
12
-
13
-
14
-
15
-
16
-
17
-
18
-
19
-
20
-
21
-
22
-
23
-
24
-
25
-
26
-
27
-
28
-
29
-
30
-
31
-
 32
32 -
 33
33 -
 34
34 -
 35
35 -
 36
36 -
 37
37 -
 38
38 -
 39
39 -
 40
40 -
 41
41 -
 42
42 -
 43
43 -
 44
44 -
 45
45 -
 46
46 -
 47
47 -
 48
48 -
 49
49 -
 50
50 -
 51
51 -
 52
52 -
53
-
54
-
55
-
56
-
57
-
58
-
59
-
60
-
61
-
62
-
63
-
64
-
65
-
66
-
67
-
68
-
69
-
70
-
71
-
72
-
73
-
74
-
75
-
76
-
77
-
78
-
79
-
80
 |
 |

[40] Sony Corporation Annual Report 1998
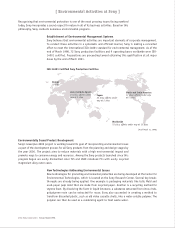
To minimize the adverse effects of foreign exchange fluctuations on its financial results and to reduce inventory
and cost, Sony promotes the localization of material and parts procurement, design, and manufacturing operations
outside Japan. During the year, Sony expanded manufacturing operations mainly in North America and Eastern Eu-
rope. Overseas activities represented approximately 50% of total manufacturing output in Sony’s Electronics business.
Sony employs foreign exchange forward contracts and foreign currency option contracts to hedge against foreign
exchange risks that arise from the export and import transactions of Sony Corporation and its consolidated subsidiar-
ies. In addition, interest rate and currency swap agreements are used in connection with certain foreign currency
denominated borrowings and debt.
During the second half of 1997, currency and economic turmoil occurred in Asia. However, the overall impact of
this situation was positive for Sony’s earnings during the year. This is mainly due to a decline in costs in Asia, a major
manufacturing base for Sony. In the year under review, Asia accounted for approximately 13% of sales in Sony’s
Electronics business, while comprising approximately 25% of manufacturing. About 63% of this manufacturing out-
put in Asia was exported for sale outside the region. However, Asian currency and economic turmoil may negatively
affect Sony’s results over the mid- to long-term.
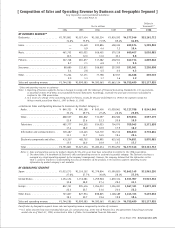
Cost of Sales and Selling, General and Administrative Expenses
During the year, cost of sales rose 17.5% to ¥4,619.0 billion ($34,992 million), mainly due to higher sales. However,
the ratio of cost of sales to consolidated sales improved 0.8 percentage point, to 71.5% due to the sales growth and
cost reductions. Research and development expenses charged to cost of sales increased 12.6% to ¥318.0 billion
($2,409 million), mainly due to increases in the semiconductor business, information and communication business,
and Game business, but declined by 0.3 percentage point as a percentage of sales, to 4.9%. Research and develop-
ment expenses for the fiscal year ending March 31, 1999 are expected to exceed those of the year under review,
mainly due to higher expenses in business areas such as broadcast-use equipment and digital network related equip-
ment as well as the semiconductor business.
Selling, general and administrative expenses rose 16.6% to ¥1,345.6 billion ($10,194 million), mainly due
to increases in sales, personnel expenses, and advertising costs in the Game business, but improved 0.4 percentage
point as a percentage of sales, to 20.8%.
Figures in the above two paragraphs do not include the Insurance segment revenue and expenses.
Operating Income
Operating income during the year grew by 40.5% to ¥520.2 billion ($3,941 million). Despite an increased operating loss
in the Other segment, higher operating income in the Electronics, Music, Pictures, and Insurance segments, and particu-
larly strong results in the Game segment, contributed to overall growth. Sales and operating income in the Game segment
reached approximately 10% and 22%, respectively, of Sony’s consolidated sales and operating income before elimination
of intersegment transactions. As a percentage of sales, operating income improved by 1.2 percentage points, to 7.7%.
Other Income and Expenses
Other income decreased 9.4% to ¥84.0 billion ($636 million), while other expenses remained at ¥150.4 billion
($1,140 million) about the same as that in the previous fiscal year. The decline in other income is primarily due to a
R&D Expenses
(Percent of Consolidated Sales*)
(Billion ¥, %)
Operating Income (Loss)
(Billion ¥)
* Excluding Insurance revenue
94
107
95 96 97 98
(167) 235 370 520
94
230
(6.3)
95 96 97 98
239
(6.2)
257
(5.9)
283
(5.2)
318
(4.9)
Ratio of Operating Income to Sales
(%)
94
2.9
95 96 97 98
— 5.1 6.5 7.7