Sony 1998 Annual Report Download - page 55
Download and view the complete annual report
Please find page 55 of the 1998 Sony annual report below. You can navigate through the pages in the report by either clicking on the pages listed below, or by using the keyword search tool below to find specific information within the annual report.-
 1
1 -
2
-
3
-
4
-
5
-
6
-
7
-
8
-
9
-
10
-
11
-
12
-
13
-
14
-
15
-
16
-
17
-
18
-
19
-
20
-
21
-
22
-
23
-
24
-
25
-
26
-
27
-
28
-
29
-
30
-
31
-
32
-
33
-
34
-
35
-
36
-
37
-
38
-
39
-
40
-
41
-
42
-
43
-
44
-
 45
45 -
 46
46 -
 47
47 -
 48
48 -
 49
49 -
 50
50 -
 51
51 -
 52
52 -
 53
53 -
 54
54 -
 55
55 -
 56
56 -
 57
57 -
 58
58 -
 59
59 -
 60
60 -
 61
61 -
 62
62 -
 63
63 -
 64
64 -
 65
65 -
66
-
67
-
68
-
69
-
70
-
71
-
72
-
73
-
74
-
75
-
76
-
77
-
78
-
79
-
80
 |
 |

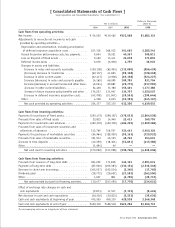
Annual Report 1998 Sony Corporation [53]
Dollars in thousands
Yen in millions (Note 3)
1996 1997 1998 1998
Cash flows from operating activities:
Net income. . . . . . . . . . . . . . . . . . . . . . . . . . . . . . . . . ¥ 54,252 ¥139,460 ¥222,068 $1,682,333
Adjustments to reconcile net income to net cash
provided by operating activities—
Depreciation and amortization, including amortization
of deferred insurance acquisition costs . . . . . . . . . . . 227,316 266,532 301,665 2,285,341
Accrual for pension and severance costs, less payments
. . . . 9,604 19,521 40,367 305,811
Loss on disposal of fixed assets . . . . . . . . . . . . . . . . . 9,429 13,411 22,678 171,803
Deferred income taxes . . . . . . . . . . . . . . . . . . . . . . . 5,070 (5,490) 4,755 36,023
Changes in assets and liabilities:
Increase in notes and accounts receivable . . . . . . . . (150,158) (65,905) (113,050) (856,439)
(Increase) decrease in inventories . . . . . . . . . . . . . (69,157) 41,825 (96,138) (728,318)
Increase in other current assets . . . . . . . . . . . . . . . (32,117) (2,906) (69,198) (524,227)
Increase (decrease) in notes and accounts payable . . (4,169) 66,099 109,785 831,704
Increase (decrease) in accrued income and other taxes . (6,064) 89,887 (28,775) (217,992)
Increase in other current liabilities. . . . . . . . . . . . . 54,438 73,786 155,401 1,177,280
Increase in future insurance policy benefits and other
. . 174,223 131,947 134,707 1,020,507
Increase in deferred insurance acquisition costs . . . . (42,798) (51,067) (39,553) (299,644)
Other . . . . . . . . . . . . . . . . . . . . . . . . . . . . . . . . . . . 4,308 6,035 (32,362) (245,167)
Net cash provided by operating activities . . . . . . . . 234,177 723,135 612,350 4,639,015
Cash flows from investing activities:
Payments for purchases of fixed assets . . . . . . . . . . . . . . (250,157) (298,187) (378,053) (2,864,038)
Proceeds from sales of fixed assets . . . . . . . . . . . . . . . . 22,823 14,940 22,413 169,795
Payments for investments and advances . . . . . . . . . . . . . (490,330) (450,399) (463,239) (3,509,386)
Proceeds from sales of investment securities and
collections of advances . . . . . . . . . . . . . . . . . . . . . . . 313,769 316,787 323,443 2,450,326
Payments for purchases of marketable securities . . . . . . . (54,964) (128,929) (95,163) (720,932)
Proceeds from sales of marketable securities . . . . . . . . . . 101,913 46,105 46,730 354,015
Increase in time deposits . . . . . . . . . . . . . . . . . . . . . . . (12,359) (18,361) (54,831) (415,386)
Other. . . . . . . . . . . . . . . . . . . . . . . . . . . . . . . . . . . . . (1,694) 46 ——
Net cash used in investing activities . . . . . . . . . . . . (370,999) (517,998) (598,700) (4,535,606)
Cash flows from financing activities:
Proceeds from issuance of long-term debt. . . . . . . . . . . . 381,239 171,698 342,101 2,591,674
Payments of long-term debt . . . . . . . . . . . . . . . . . . . . . (87,500) (209,383) (332,154) (2,516,318)
Decrease in short-term borrowings . . . . . . . . . . . . . . . . . (145,527) (192,034) (2,345) (17,765)
Dividends paid . . . . . . . . . . . . . . . . . . . . . . . . . . . . . . (18,772) (18,657) (21,582) (163,500)
Other. . . . . . . . . . . . . . . . . . . . . . . . . . . . . . . . . . . . . 1,037 881 (3,790) (28,712)
Net cash provided by (used in) financing activities. . . . 130,477 (247,495) (17,770) (134,621)
Effect of exchange rate changes on cash and
cash equivalents . . . . . . . . . . . . . . . . . . . . . . . . . . . . (9,871) 11,537 (1,112) (8,424)
Net decrease in cash and cash equivalents . . . . . . . . . . . (16,216) (30,821) (5,232) (39,636)
Cash and cash equivalents at beginning of year . . . . . . . . 475,555 459,339 428,518 3,246,348
Cash and cash equivalents at end of year . . . . . . . . . . . . ¥459,339 ¥428,518 ¥423,286 $3,206,712
The accompanying notes are an integral part of these statements.
[ Consolidated Statements of Cash Flows ]
Sony Corporation and Consolidated Subsidiaries •Year ended March 31