Sony 1998 Annual Report Download - page 76
Download and view the complete annual report
Please find page 76 of the 1998 Sony annual report below. You can navigate through the pages in the report by either clicking on the pages listed below, or by using the keyword search tool below to find specific information within the annual report.-
 1
1 -
2
-
3
-
4
-
5
-
6
-
7
-
8
-
9
-
10
-
11
-
12
-
13
-
14
-
15
-
16
-
17
-
18
-
19
-
20
-
21
-
22
-
23
-
24
-
25
-
26
-
27
-
28
-
29
-
30
-
31
-
32
-
33
-
34
-
35
-
36
-
37
-
38
-
39
-
40
-
41
-
42
-
43
-
44
-
45
-
46
-
47
-
48
-
49
-
50
-
51
-
52
-
53
-
54
-
55
-
56
-
57
-
58
-
59
-
60
-
61
-
62
-
63
-
64
-
65
-
 66
66 -
 67
67 -
 68
68 -
 69
69 -
 70
70 -
 71
71 -
 72
72 -
 73
73 -
 74
74 -
 75
75 -
 76
76 -
 77
77 -
 78
78 -
 79
79 -
 80
80
 |
 |

[74] Sony Corporation Annual Report 1998
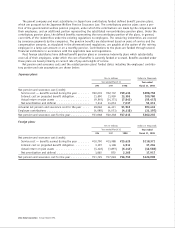
The following information is sales and operating revenue and operating income which show those recognized by
geographic origin for the years ended March 31, 1996, 1997 and 1998. In addition to the disclosure requirements
under FAS 131, the company discloses this information as the supplemental information in light of the disclosure
requirement of the Japanese Securities and Exchange Law, which a Japanese public company is subject to.
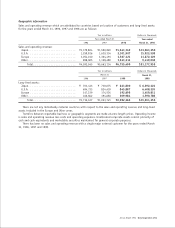
Yen in millions Dollars in thousands
Year ended March 31 Year ended
1996 1997 1998 March 31, 1998
Sales and operating revenue:
Japan —
Customers . . . . . . . . . . . . . . . . . . . . . . . ¥1,768,132 ¥2,048,406 ¥2,361,734 $17,891,924
Intersegment . . . . . . . . . . . . . . . . . . . . . 1,275,251 1,386,422 1,697,655 12,861,023
Total . . . . . . . . . . . . . . . . . . . . . . . . . 3,043,383 3,434,828 4,059,389 30,752,947
U.S.A. —
Customers . . . . . . . . . . . . . . . . . . . . . . . 1,250,712 1,672,173 2,156,173 16,334,644
Intersegment . . . . . . . . . . . . . . . . . . . . . 113,121 126,637 153,603 1,163,659
Total . . . . . . . . . . . . . . . . . . . . . . . . . 1,363,833 1,798,810 2,309,776 17,498,303
Europe —
Customers . . . . . . . . . . . . . . . . . . . . . . . 886,468 1,100,958 1,338,232 10,138,122
Intersegment . . . . . . . . . . . . . . . . . . . . . 30,299 42,381 62,506 473,530
Total . . . . . . . . . . . . . . . . . . . . . . . . . 916,767 1,143,339 1,400,738 10,611,652
Other —
Customers . . . . . . . . . . . . . . . . . . . . . . . 687,253 841,597 899,351 6,813,265
Intersegment . . . . . . . . . . . . . . . . . . . . . 509,120 603,518 715,156 5,417,849
Total . . . . . . . . . . . . . . . . . . . . . . . . . 1,196,373 1,445,115 1,614,507 12,231,114
Elimination . . . . . . . . . . . . . . . . . . . . . . . . (1,927,791) (2,158,958) (2,628,920) (19,916,061)
Consolidated. . . . . . . . . . . . . . . . . . . . . . . . . ¥4,592,565 ¥5,663,134 ¥6,755,490 $51,177,955
Operating income:
Japan . . . . . . . . . . . . . . . . . . . . . . . . . . . . ¥147,582 ¥259,376 ¥348,458 $2,639,833
U.S.A. . . . . . . . . . . . . . . . . . . . . . . . . . . . 32,372 30,928 75,820 574,394
Europe . . . . . . . . . . . . . . . . . . . . . . . . . . . 48,621 70,597 74,064 561,091
Other . . . . . . . . . . . . . . . . . . . . . . . . . . . . 55,772 69,858 69,490 526,440
Corporate and elimination . . . . . . . . . . . . . . (49,023) (60,429) (47,622) (360,773)
Consolidated. . . . . . . . . . . . . . . . . . . . . . . . . ¥235,324 ¥370,330 ¥520,210 $3,940,985